
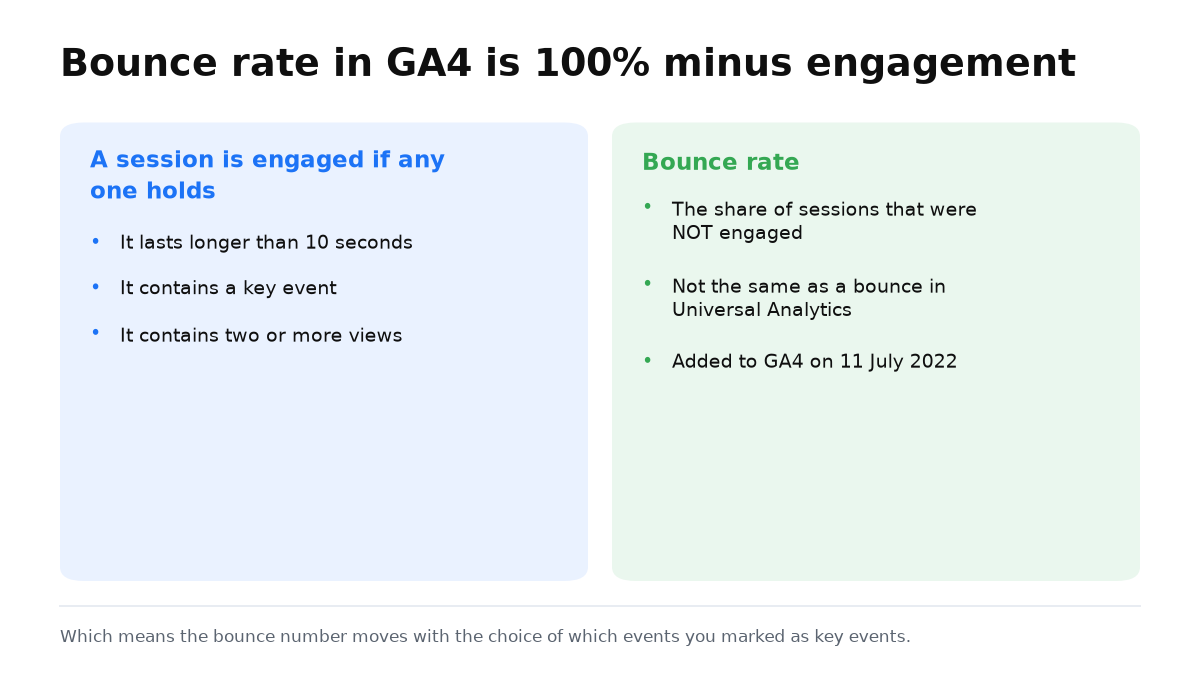
Bounce rate exists in GA4. Google added it on July 11, 2022, but the familiar name now describes a different calculation. In GA4, bounce rate is the share of sessions that were not engaged, which makes it the inverse of engagement rate.
This is why comparing your current figure with old Universal Analytics benchmarks is misleading. A bounce used to mean a session with one page view. In GA4, one view does not settle the question because the system also considers duration, key events, and the number of views.
For an owner, this is a diagnostic metric rather than an answer about profit. In the guide to advertising analytics for business owners, behavioral metrics sit next to commercial results instead of replacing them. Bounce rate can suggest where to investigate, but it cannot prove whether advertising is profitable.
What counts as a bounce in GA4
To interpret bounce rate correctly, start with the definition of an engaged session. According to the official Google Analytics definition, a session is engaged when it meets at least one condition: it lasts longer than 10 seconds, contains a key event, or includes at least 2 page or screen views.
| What happened during the session | How GA4 classifies it | What it means for the owner |
|---|---|---|
| At least one engagement condition was met | Engaged session | It contributes to engagement rate |
| No engagement condition was met | Session was not engaged | It contributes to bounce rate |
| The set of key events changed | Session classification may change | Period comparisons need context |
Bounce rate and engagement rate are therefore two sides of the same calculation. The Google Analytics bounce rate guidance confirms this directly. A high engagement rate means a low bounce rate, not a separate parallel signal.
Why old bounce rate benchmarks no longer apply
The unchanged metric name creates an illusion of continuity. It looks as if the old report simply moved into a new interface. The object being measured has actually changed. Universal Analytics looked at a session with one view, while GA4 looks for the absence of engagement under its own conditions.
Imagine a visitor who opens a page, reads it for longer than 10 seconds, and leaves without a second view. Under the old logic, the single view could count as a bounce. Under GA4 logic, duration already makes the session engaged. The same behavior receives a different classification, so the old benchmark answers a different question.
The reverse scenario matters too. If an action was marked as a key event and later loses that status, some sessions may no longer qualify as engaged. A visible change in bounce rate does not necessarily mean the audience became worse. First check whether the definition of the result changed.
How to read bounce rate without a false diagnosis
- Check the current key events. Without that list, you do not know which customer actions can qualify a session as engaged.
- Compare like with like. Use periods with the same key event definition. If the setup changed, mark the change in your report.
- Separate pages by intent. A page that gives a short answer and a page that asks for an inquiry naturally produce different behavior.
- Place a business result beside the metric. If bounce rate changes while qualified inquiries do not, avoid making a budget decision from behavior alone.
This sequence delivers the practical answer: you know what GA4 measures, why the old benchmark does not fit, and what to verify before drawing a conclusion.
My e-book “19 Google Ads Secrets”: how to get the most out of Google Ads without draining your budget, drawn from real campaigns and tests.
See the book →When this does not apply
Bounce rate cannot evaluate advertising when key events represent accidental clicks rather than real business results. It also cannot support a fair comparison if the measurement setup changed between periods. Website behavior does not replace payment, margin, or inquiry quality data. In these cases, fix the result definition first and interpret the percentage afterward.