

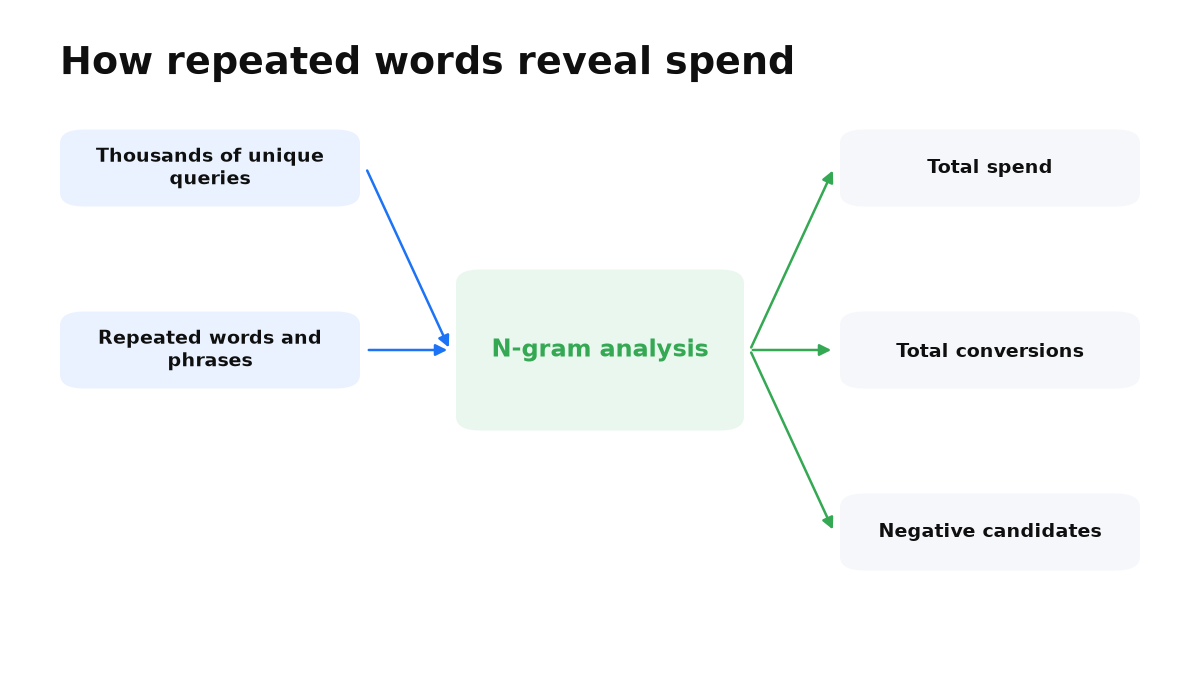
N-gram analysis turns a long Google Ads search terms export into a compact view of repeated words and phrases. It reveals which ideas consume budget across many different searches and whether those ideas contribute conversions.
You can run the method in a standard spreadsheet in one evening. Export the search terms, split them into n-grams, aggregate cost and outcomes for each n-gram, then review the full queries before creating any negative keywords.
What an n-gram means in search term analysis
In this method, an n-gram is a recurring word or sequence of words found across a set of search terms. People can express the same need in many ways, so an entire query may never repeat. Its meaningful parts often do.
The n-gram, rather than the full query, becomes the unit of analysis. In my experience, the same irrelevant intent can hide inside thousands of unique searches. Removing complete queries catches versions you have already seen. Grouping their repeated words and phrases exposes the underlying pattern.
Start with the Google Ads search terms report. It shows actual searches that triggered your ads, although terms with low query activity may be omitted for privacy. Google describes the report and this limitation in its search terms report documentation.
Why reviewing individual queries does not scale
A search terms report can look like a collection of unrelated exceptions. You exclude an obviously irrelevant query, but a new variation appears later. The wording changed while the unwanted intent remained.
A relevant service name might repeatedly appear beside words that signal a job seeker, free resource, tutorial, or different product. Each complete query looks new. The recurring word is the common cause, and an n-gram table puts its accumulated cost and outcomes in one row.
Frequency is a clue, not a verdict. A common word may also appear in profitable searches. Judge it using cost, conversions, conversion value, and the complete queries in which it appears.
How to build an n-gram spreadsheet
Download enough search term history to reflect your normal demand and conversion cycle. Keep the search term, campaign, ad group, matched keyword, match type, cost, conversions, and conversion value when available. Avoid blending periods with materially different offers, locations, or measurement setups.
Work from a copy of the export:
- Normalize the text. Use consistent case, remove extra spaces, and separate punctuation that would split identical terms into different groups.
- Expand the queries. In Google Sheets, select “Data” and “Split text to columns,” using “Space” as the separator. Copy each populated word column below the previous one in a new n-gram column. Beside every copied block, copy the query ID, full search, and metrics from the same source rows, then remove blank rows. For adjacent phrases, join each split cell with the next cell in separate columns, then stack those phrase columns in the same way. Extend a phrase by joining the next adjacent cell before stacking. Remove duplicates using the pair “query ID + n-gram,” so one n-gram cannot repeat a query’s cost.
- Carry over performance data. Each expanded row should retain the cost, conversions, and value of the search term it came from.
- Build a pivot table. Put the n-gram in Rows. Add Cost, Conversions, and Conversion value to Values using Sum, then add Query ID to Values using Count. You now have both spend and a count of searches containing the n-gram.
- Prioritize the review. Inspect meaningful spend without conversions first, then review groups whose cost and value do not fit your business economics.
A single search term contributes data to several n-grams, so rows in the n-gram table overlap. Do not add them together or reconcile their total with account spend. Each row only shows what happened to queries containing one n-gram.
| Field | What it represents | How to use it |
|---|---|---|
| N-gram | A recurring word or phrase | Identify the idea shared by different searches |
| Cost | Spend from queries containing the n-gram | Prioritize material patterns |
| Conversions | Recorded outcomes from those queries | Assess the risk of removing useful traffic |
| Conversion value | Measured value attributed to those queries | Compare the group with business economics |
| Share of cost without conversions | Nonconverting query cost relative to all cost for the n-gram | Surface repeated waste |
| Query examples | Full searches behind the aggregate | Verify intent before acting |
How to calculate the cost and profitability of a word
The cost of an n-gram is the total cost of queries that contain it. Cost alone does not make a word bad. Compare it with conversions and conversion value. If Google Ads does not receive value data, use the available conversion signal and check lead quality and sales in your own records.
A useful diagnostic is the share of cost without conversions. Divide the cost of nonconverting queries containing the n-gram by all cost associated with that n-gram. There is no universal cutoff. A reasonable result depends on margin, customer value, conversion delay, and measurement quality.
Always move from the aggregate back to the complete search terms. A word can signal valuable demand in one context and irrelevant intent in another. If useful queries exist, exclude a more specific phrase or adjust campaign structure instead of blocking the word everywhere.
How much search term data you need
There is no fixed minimum. You have enough data when recurring words form meaningful groups and conversions have had time to appear in the report. Choose the date range around the buying and conversion cycle of your business.
If the report contains only dozens of queries, broad conclusions may be premature. Review the most expensive searches manually, remove only obvious mismatches, and collect more data. Do not combine old and new periods blindly when the offer, website, location, or conversion tracking has changed.
How to create negative keywords without blocking good demand
The pivot table creates candidates, not final exclusions. For each candidate, read the complete searches and check whether the intent is consistently unwanted. Treat brand names, locations, services, and context-dependent words with extra care.
Adding a single word as a broad match negative blocks future queries containing that word, including formulations that have never appeared in the report. This is why word-level analysis scales. It is also why one mistaken decision can remove valuable future demand at scale.
Here is the chain: “jobs” groups searches such as “air conditioner repair technician jobs,” “air conditioning installer jobs,” and “repair technician jobs near me.” If every full query represents job-seeking intent, one broad negative, “jobs,” blocks that batch and future searches containing the same word.
Negative keywords do not automatically match close variants or other expansions. Another form of the word may still trigger an ad. Review the matching behavior in Google’s negative keyword documentation before you upload the list.
Keep candidates on a separate sheet with query examples and a reason for each decision. Start with single words. Preserve a phrase separately only when its neighboring word consistently changes the intent while the single word appears in both useful and unwanted searches. After applying negatives, monitor traffic and conversions.
My Adworld Experience case study of n-gram analysis shows how the approach worked in a large account; it illustrates the method and does not forecast a reader’s result.
Do you need a dedicated n-gram tool
A spreadsheet with text splitting and pivot tables is enough for an initial analysis. A script or dedicated tool becomes convenient for very large exports, recurring reviews, or phrase-level combinations. The decision process remains the same.
Automate data preparation, not the final negative keyword decision. Software can find repetitions and aggregate metrics, but it does not know your margins, lead quality, or the meaning a word has in your particular market.
Repeat the table after a campaign launch, a match type change, or a material budget increase, then with each new lead cycle that brings new search terms. If the data has not changed, rebuilding the pivot adds nothing.
When this does not apply
N-gram analysis lacks reliable evidence when traffic is low and the report contains only dozens of queries. It also cannot repair broken conversion tracking. A precise spreadsheet built on a faulty outcome signal still produces the wrong decisions.
The analysis becomes misleading when different languages, offers, business models, or seasons are combined without segmentation. It also does not replace ongoing search term reviews. New formulations continue to appear, and close variants of negative keywords may pass through.
If the table has produced candidates but you are afraid a broad negative will block qualified demand, the webinar shows how to test that decision against full queries, conversions, and lead economics.
Keywords and negatives are half the job; the other half is what happens after the click. My e-book “19 Google Ads Secrets” shows how to get the most out of Google Ads without draining your budget, drawn from real campaigns and tests.
See the book →Questions about n-gram analysis
Should I analyze single words only?
Single words are the clearest starting point. Then examine recurring phrases where a neighboring word changes intent or excluding the word broadly could block useful searches.
Why can n-gram cost exceed account spend?
The cost of one search term is repeated across the rows for every word it contains. The rows are overlapping views of performance, not separate portions of spend that should be added together.
Can I upload the suggested negatives automatically?
No. Automation can prepare candidates, but each one needs a review of full queries, outcomes, and match behavior. Otherwise a mass cleanup can block qualified demand just as widely.