
Here are three numbers from real accounts, not from surveys. According to the Ivitskiy Ads Lab panel, the median advertiser spends 39.4% of visible search spend on queries that produced zero leads (84 advertisers, 2023 to 2025 windows). One in three target-CPA campaigns, 33.5% to be exact, misses its target by 20% or more (239 campaigns from 23 advertisers, January to May 2026). Ecommerce accounts in this panel show a median search CTR of 12.43% for 2025 and a median CPC of $0.43 (20 advertisers). Below are the full tables, the limits of the sample, and the CSV files.
Where the numbers come from and why they can be trusted
This is not a survey and not a guess. The source is a panel of 124 spend-active advertisers from one manager account (MCC) run by our agency, monthly from January 2018 to July 2026, plus 33 accounts we audited in windows from 2023 to 2026. Tracked search spend across both samples is $85 million according to the dataset description. Every published cell aggregates at least 5 independent advertisers, accounts belonging to one client are collapsed into a single entity first, and no names, domains or account codes appear anywhere in the data.
I collected the data. I am Igor Ivitskiy: PhD in mathematical modeling, author of more than 200 scientific publications, working with Google Ads since 2012, running the Ivitskiy Ads Lab agency and online school. In 2026 I am ranked sixth in The Top 50 Most Influential PPC Experts by ppcsurvey.com. None of that makes the sample representative: according to the dataset description it skews to Eastern Europe and international SaaS, and the country of the advertised business is not recorded. That is why every number below is presented as “in our sample”, never as a market norm.
Table 1. Share of spend on queries with zero leads
The metric is simple: take the search terms report, sum the cost of queries that produced zero attributed conversions across the whole window, and divide by all tracked cost. It is computed per advertiser, then we look at the distribution. According to the dataset, the median advertiser lands at 39.4%.
| Vertical | Advertisers | Median | Lower quartile (Q1) | Upper quartile (Q3) | Spend-weighted |
|---|---|---|---|---|---|
| Whole sample | 84 | 39.4% | 28.0% | 67.0% | 22.3% |
| Ecommerce | 14 | 61.9% | withheld | withheld | withheld |
| Local services | 7-9 | 57.7% | withheld | withheld | withheld |
| SaaS and utilities | 17 | 29.6% | 18.7% | 34.6% | 22.3% |
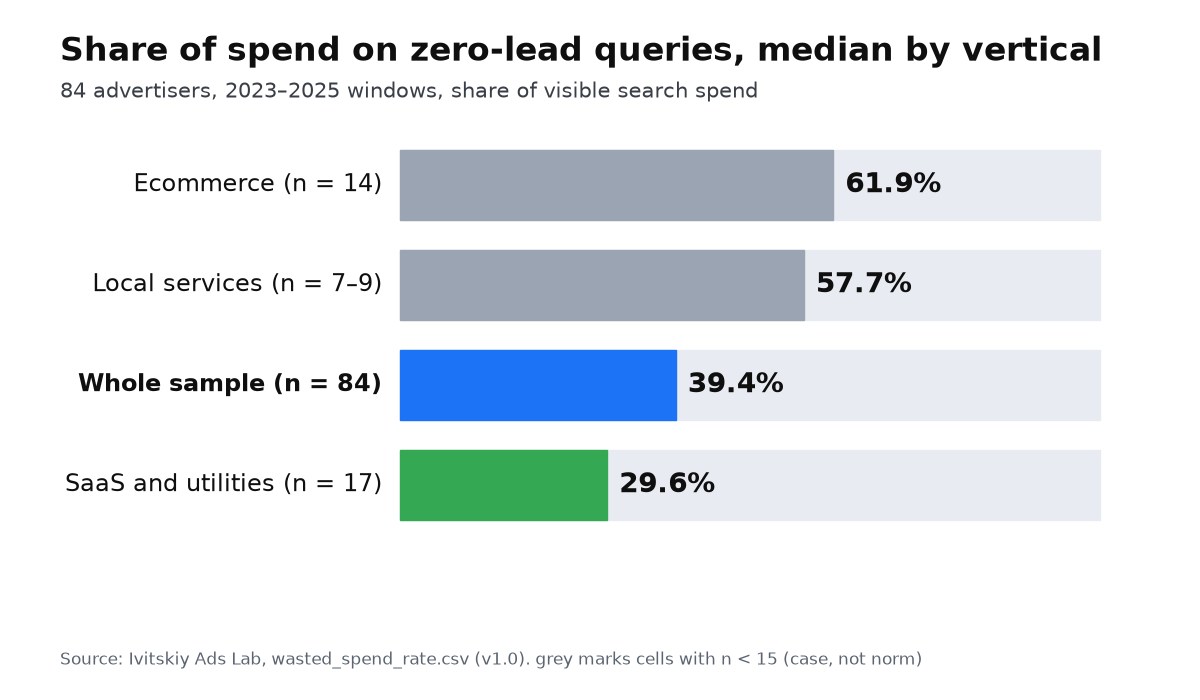
The two numbers in the first row answer different questions. The median of 39.4% says how much the typical advertiser in the sample wastes. The spend-weighted share of 22.3% says how much the typical dollar wastes: according to the dataset, larger budgets show a proportionally lower share of zero-conversion queries, and the data does not say why. If your budget is small, the median is your reference point, not any “market average”.
Read the vertical rows with care. SaaS and utilities has 17 advertisers, so 29.6% can be called typical for the sample. Ecommerce has 14: 61.9% is the median among 14 advertisers in our sample, and the spend-weighted share for them is withheld because, under the dataset’s build rule, one advertiser accounts for more than 40% of that cell’s spend. Local services has 7-9 advertisers, so only the median is shown. What to do about it is covered in Google Ads waste: queries with zero leads.
Table 2. Smart Bidding: how far campaigns land from target
An advertiser sets a target CPA (tCPA) or a target ROAS (tROAS). We compute a miss ratio: achieved CPA divided by target CPA (for tROAS the other way round: target ROAS divided by achieved ROAS). A value of 1.0 means exactly on target. For tCPA, 1.2 means a cost per conversion 20% above target. For tROAS, 1.2 means a return roughly 17% below target, because there the target is divided by the achieved value. According to the dataset description, the slice includes campaigns with an active target and at least 5 conversions in the January to May 2026 window, with targets taken from a July 2026 snapshot.
| Strategy | Campaigns / advertisers | Median miss ratio | Q1 | Q3 | On target or better | Miss by 20% or more |
|---|---|---|---|---|---|---|
| tCPA | 239 / 23 | 1.029 | 0.813 | 1.325 | 47.3% | 33.5% |
| tROAS | 64 / 15 | 0.959 | 0.765 | 1.463 | 56.3% | 31.3% |
| Strategy, advertiser level | Advertisers | Median miss ratio | Q1 | Q3 | Median campaign on target | Miss by 20% or more |
|---|---|---|---|---|---|---|
| tCPA | 23 | 0.977 | 0.757 | 1.113 | 60.9% | 8.7% |
| tROAS | 15 | 0.977 | 0.641 | 1.409 | 53.3% | 33.3% |
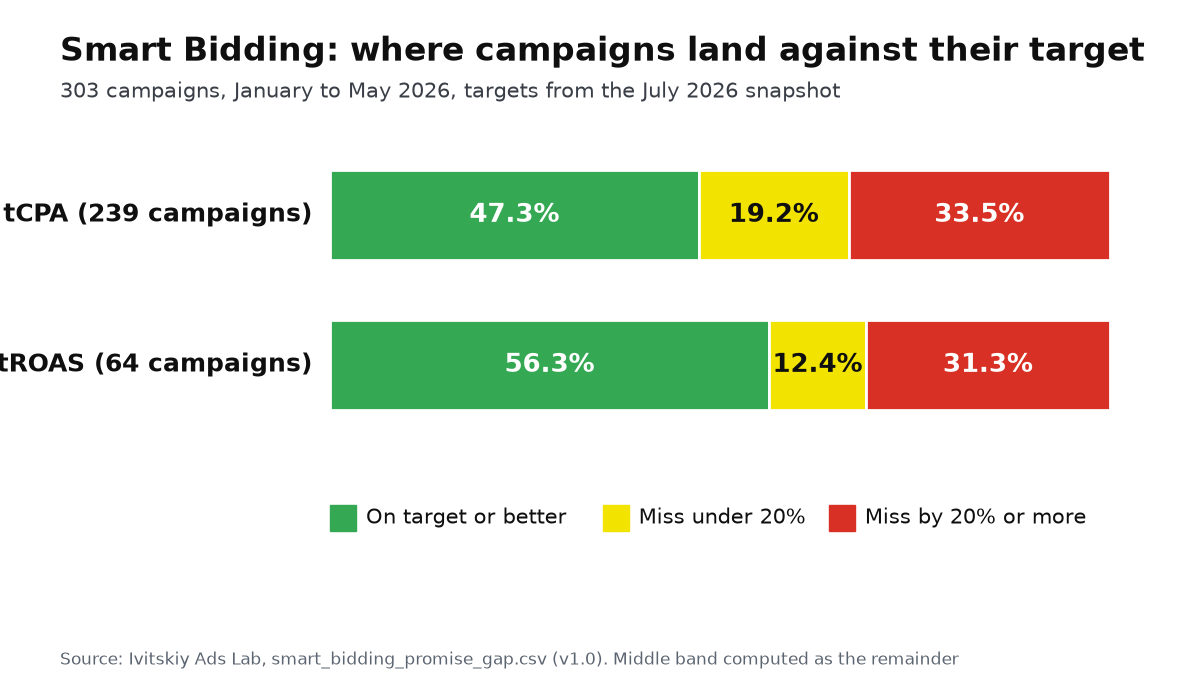
The main takeaway from the two tables: individual campaigns miss often, advertisers rarely do. According to the dataset, 33.5% of tCPA campaigns missed by 20% or more, yet 60.9% of advertisers have their median campaign on target. An advertiser median hides campaign-level misses: one campaign overshoots, another undershoots, and the median stays near target. This is not a portfolio total: the dataset publishes no advertiser-level totals. The middle band on the chart (miss under 20%) is computed as the remainder: 19.2% for tCPA and 12.4% for tROAS.
Three honest limits of this metric, according to the dataset description. Target history is not exposed by the API, so if an advertiser changed the target inside the window, part of the “miss” is self-inflicted. The metric cannot separate an algorithm shortfall from an unrealistic target. The 5-conversion floor skews the sample toward campaigns that work at all, so campaigns with fewer than 5 conversions, zero included, are excluded altogether. How to read the ratio and what to do with a campaign that missed is covered in Smart Bidding vs target.
If you are looking at these two tables and wondering where your own account sits in the distribution, there is a shorter route than computing it yourself. We look at the account and within 15 minutes tell you what share of spend goes to zero-lead queries and which campaigns are missing their target.
My e-book “19 Google Ads Secrets”: how to get the most out of Google Ads without draining your budget, drawn from real campaigns and tests.
See the book →Table 3. CTR and CPC by vertical, 2025 and 2026
Everyone publishes these two metrics, so they are here for comparison, not as the headline finding. The median is taken across advertisers, search campaigns only, rows with 5 or more advertisers across the whole window only. Money is converted to USD at a fixed July 2026 rate, the same rate is applied to every year, so it does not distort year-over-year movement, but it also hides real currency swings: CPC in hryvnia or euro may have moved differently.
| Vertical | Advertisers, whole window | Year | CTR, median | CTR, Q1 and Q3 | CPC, median | CPC, Q1 and Q3 |
|---|---|---|---|---|---|---|
| Ecommerce | 20 | 2025 | 12.43% | 7.80% and 22.15% | $0.43 | $0.20 and $0.95 |
| 2026, first half | 17.36% | withheld | $0.42 | withheld | ||
| B2B and industrial | 11 | 2025 | 6.62% | withheld | $0.28 | withheld |
| 2026, first half | 7.03% | withheld | $0.49 | withheld | ||
| Home services | 11 | 2025 | 4.57% | withheld | $1.84 | withheld |
| 2026, first half | 6.37% | withheld | $2.22 | withheld | ||
| Automotive | 7 | 2026, first half | 10.6% | withheld | $0.23 | withheld |
| Healthcare | 5 | 2025 | 9.83% | withheld | $0.91 | withheld |
| Local services | 6 | 2025 | 5.28% | withheld | $0.51 | withheld |
Only the ecommerce row has 20 advertisers, and only that row can be called typical for the sample. Every other row reads “among 11, 7, 6 or 5 advertisers in our sample”, and that is how it should be quoted. CPCs here are several times lower than the US figures in Table 4, and the plausible reason is the panel’s geography and a different auction: the dataset description says it skews to Eastern Europe. We cannot prove it from the data itself, because the country of the advertised business is not recorded and the aggregation methods differ. Prices for 18 industries in Ukraine are collected separately in how much Google Ads costs in Ukraine in 2026.
Table 4. Our panel against published market numbers
Alongside the panel we compiled 1,516 published values from 12 publisher families, each with its source URL and an exact quote. The comparisons below do not show “who is better”; they show how much markets and methods differ: we report medians across advertisers, WordStream reports averages across US campaigns, and industry categories do not map one to one.
| What is compared | Our panel (median) | Published number | Source |
|---|---|---|---|
| Search CTR, ecommerce (ours) vs all industries (theirs) | 12.43% for 2025, 20 advertisers | 6.64% average CTR, 13,474 US campaigns | WordStream / LocaliQ, Google Ads Benchmarks 2026 |
| CPC, ecommerce vs all industries | $0.43 for 2025 | $5.42 average CPC in the US | WordStream / LocaliQ 2026 |
| Home services: CTR and CPC | 4.57% and $1.84 for 2025, 11 advertisers | 6.47% and $8.33, Home & Home Improvement category | WordStream / LocaliQ 2026 |
| B2B and industrial: CTR and CPC | 6.62% and $0.28 for 2025, 11 advertisers | 6.57% and $5.87, Industrial & Commercial category | WordStream / LocaliQ 2026 |
| Healthcare: CTR and CPC | 9.83% and $0.91 for 2025, 5 advertisers | 5.81% and $6.17, Health & Fitness category | WordStream / LocaliQ 2026 |
| Global search averages, all industries | no “all industries” row in the panel | CTR 3.17% and CPC $2.69 (Store Growers); median CTR 4.70% and CPC $1.53 (Databox) | Store Growers 2026, Databox 2026 |
What an owner should take from this. If you advertise in a market similar to our panel and someone shows you an “industry average CPC” from a US report, that number does not apply to you: according to both tables the CPC gap runs from about four to twenty times depending on the pair. And the reverse holds: our 12.43% ecommerce CTR does not mean a US store with a 6% CTR is doing badly, because it is a different auction and a different sample.
When this does not apply
- As a market or country norm. This is an agency’s convenience sample, not a representative panel. The country of the advertised business is not recorded; according to the dataset description the panel skews to Eastern Europe and international SaaS. For US and Western European levels use Table 4 and its sources.
- Rows with few advertisers. Anything below 15 advertisers (local services and ecommerce in Table 1, every vertical except ecommerce in Table 3) reads “among N advertisers in our sample”, with no quartiles and without the word “typical”.
- The waste share is computed on visible spend. Google shows search terms only above a privacy threshold; according to the dataset description tracked terms cover about 67% of this panel’s search spend. My view is that the hidden tail converts worse, so the true share is more likely higher, but that is a judgment, not a measurement.
- “Zero conversions” means zero attributed conversions under the account’s own settings. If conversion tracking is not set up, a query looks like waste even when a lead came in. This is also why we do not compare CPA or ROAS across advertisers: every account counts different events.
- A miss is not the same as an algorithm error. Targets come from a July 2026 snapshot and their change history is not exposed by the API; an unrealistic target produces the same “miss” as a weak campaign.
- Money is converted at a fixed July 2026 rate. Year-over-year CPC movement in non-USD accounts partly reflects exchange rates, not the auction.
- Stability of the numbers. A leave-one-advertiser-out check cannot be computed from the published CSVs, because they contain no per-advertiser rows. We ran it on 7 September 2026 against our own warehouse, and the result is in the stability section above: some numbers are typical for the sample, some rest on a few clients, and a few rows should not be quoted at all.
What is inside the sample
- According to the dataset description: 124 spend-active advertisers from one MCC, January 2018 to July 2026, and 33 audited accounts in windows from 2023 to 2026. Total managed spend of the MCC panel is $16.8 million; tracked search spend across both samples is $85 million; the Smart Bidding slice covers $0.85 million. These are three different scopes and they do not contradict each other: USD 85M exceeds USD 16.8M because tracked spend also covers the 33 separately audited accounts, several of them large international SaaS advertisers whose budgets are not part of the MCC panel.
- Anonymity per the dataset dictionary: a cell needs at least 5 advertisers after collapsing accounts of the same client; quartiles need 15; spend-weighted shares need 10 and a largest-spender share of at most 40%; counts below 10 are binned; per-year counts and per-vertical spend totals are not published; search terms were stripped of personal data.
- There are deliberately no cross-advertiser benchmarks for CPA, ROAS or conversion rate: according to the dataset description, averaging conversions that mean different things produces numbers that look precise and mean nothing.
- The market compilation: according to the dataset description, 1,516 values from 12 publisher families (WordStream/LocaliQ 2016 to 2026, Databox, Store Growers, First Page Sage, Wolfgang Digital, Optmyzr, SISTRIX, Adthena, Varos, Google), each with a URL and a quote, with 30 headline values independently re-verified.
How to cite and where to download the data
The data is open under CC BY 4.0: use it any way you like, commercially included, with attribution. The citation rule is simple: number, period, sample and a link to this page. Reference format:
Ivitskiy, I. (2026). Ivitskiy Ads Lab Google Ads Panel & Benchmark Compilation 2026 [Data set], version 1.0. https://ivitskiy.com/blog/en/google-ads-benchmarks-2026/
An example sentence with the right caveats, following the dataset’s own format: “According to Ivitskiy Ads Lab (2026), in the 2023 to 2025 windows the median advertiser spent 39.4% of visible search spend on queries with zero attributed conversions (84 advertisers; convenience sample, business country not recorded).”
- wasted_spend_rate.csv: share of spend on zero-lead queries by vertical (Table 1).
- smart_bidding_promise_gap.csv: miss ratio at campaign level (Table 2, upper part).
- smart_bidding_promise_gap_advertiser_level.csv: the same at advertiser level (Table 2, lower part).
- panel_ctr_cpc_by_vertical_year.csv: CTR and CPC by vertical and year (Table 3).
Percentages in the files are stored in 0 to 100 units, money is in USD at a fixed rate, and an empty cell means “withheld under the anonymity rule”, not zero. Author: Igor Ivitskiy, ORCID 0000-0002-9749-6414. Updates are planned once a year; the next release will extend the panel into 2027.
Questions and answers
Can I use 39.4% as the norm for my account?
No. It is the median among 84 advertisers in a convenience sample, not a market norm. Use it as a reference point: if your share is above 67.0% (the top quarter of the sample according to the dataset), you have an obvious first step; if it is below 28.0%, cleaning queries further is probably not your main task.
Why is there no CPA by vertical?
Because every account counts different conversions: a purchase, a lead, a call, a trial. According to the dataset description, averaging such numbers across advertisers produces a figure that looks precise and means nothing, so only metrics that are comparable by construction are published: CTR, CPC, spend shares and within-campaign ratios.
How do I check my own account against these tables?
You can compute the waste share yourself from the search terms report for the last 90 days: cost of queries with zero conversions divided by total cost. The miss ratio comes from the “Cost per conversion” and “Target CPA” columns of each campaign. If you would rather have us do it, see the Google Ads campaign audit checklist.
Going deeper into these two tables: wasted spend on zero-conversion queries and whether Smart Bidding hits its target.