
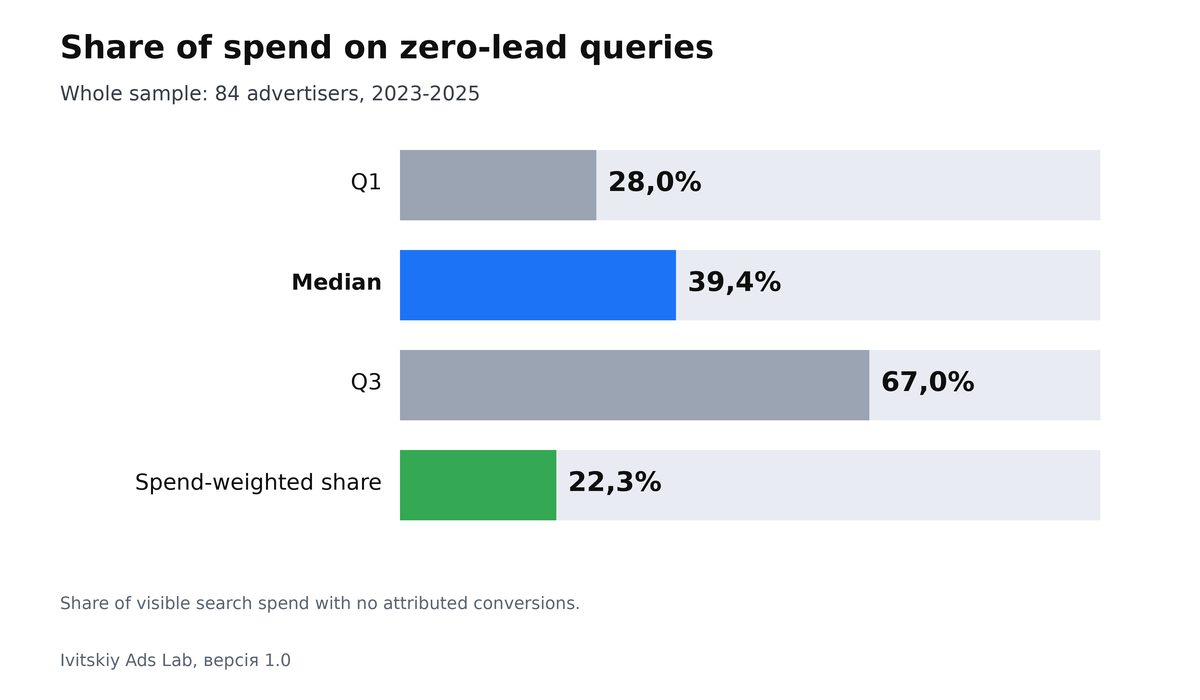
The median advertiser spends 39.4% of visible search costs on queries with zero attributed conversions. This covers 84 advertisers, windows 2023 to 2025. I am not calling this a market benchmark and I am not replacing your account reality with it. This is simply a sample description. It shows the distribution across the accounts we analyzed.
Below I will show what hides behind this percentage, a breakdown by niche, and five steps to fix this in one evening. I will also point out what not to do and when this approach does not apply. If you do not feel like digging into the reports yourself after reading this, there is a shortcut.
What exactly we measure
We take the search terms report. We only look at the spend Google actually reveals at the query level. For each row we ask if there was at least one attributed conversion during the window. If the answer is zero, this money goes into the numerator. We divide this by all tracked search spend for this advertiser, meaning spend on disclosed search terms rather than the whole search budget. This gives us the percentage.
A conversion here is not my personal estimate of a click’s value. It is what the account itself defines as a conversion. It could be a form submission, a phone call if tracked, or a purchase. It is exactly what sits in the Conversions column. If the account only tracks form submissions, an offline register purchase does not exist for this metric. If they only track purchases, an unpaid lead does not exist either.
Zero attributed conversions does not mean zero actual leads. A person could have called from their mobile phone, and this call missed the report. They could have visited the physical store after the click and paid on the spot. The tracking code on the website might have been broken for a week, making all real leads from that week look like wasted spend. That is why step 2 below comes before adding a single negative keyword. You must check your tracking first, and only then trim your vocabulary.
How this looks across niches
We calculate this for each advertiser separately, then look at the distribution. The 39.4% median tells us how much a typical advertiser in this sample wastes. The 22.3% spend-weighted rate tells us how much a typical dollar wastes. In this sample, large budgets show a lower percentage. If your budget is small, look at the median rather than the weighted share. This describes the sample, not a target for your account: your own number comes from your own report, not the weighted figure.
| Niche | Advertisers | Median | Lower quartile (Q1) | Upper quartile (Q3) | Spend-weighted |
|---|---|---|---|---|---|
| Entire sample | 84 | 39.4% | 28.0% | 67.0% | 22.3% |
| E-commerce | 14 | 61.9% | not published | not published | not published |
| Local services | 7-9 | 57.7% | not published | not published | not published |
| SaaS and services | 17 | 29.6% | 18.7% | 34.6% | 22.3% |
Read the niche rows with different expectations. SaaS and services have 17 advertisers, so you can treat 29.6% as a solid benchmark for this sample. E-commerce has 14 advertisers, and local services have 7-9. They only show the median, and I do not call it a niche standard. If you need more than just this slice, the complete benchmark tables and CSV files are available separately.
On September 7, 2026, we recalculated these numbers by sequentially removing one advertiser at a time. The 39.4% median for the entire sample is stable: dropping any single advertiser moves it by 1.1%. The 29.6% SaaS median is stable as well. The 22.3% weighted rate, local services, and e-commerce lean heavily on a few clients. This is a sample quirk, not a niche rule. Frankly speaking, in 15 out of 20 cells, one large client drives most of the spend. Therefore, you can cautiously cite the SaaS row as a sample benchmark. Treat the e-commerce and local services rows simply as what happened in these specific accounts.
Why the rate is higher in some niches
The table highlights the difference. It does not prove the cause. Below is an explanation drawn from practice and actual accounts, not from the dataset. If someone presents this as a data-driven conclusion, those are not my words.
Broad match and Performance Max generate a long tail. You bid on the word sneakers, and your ad shows up for how to choose gym sneakers, size charts, and brand history. Every click like that costs money. In the report, these are separate rows with zero leads. Performance Max goes even further. It does not need a keyword list. It takes your website, headlines, and product feed, and finds queries on its own. The tail grows longer because the doors are wide open.
E-commerce naturally gets many informational queries due to the nature of their inventory. A person compares models, reads reviews, looks for a manual, or asks if a part fits. The ad has already appeared because the product is in the feed or the keyword is broad, but there is no lead yet, and there might never be one. Local services show a different picture. The word plumber pulls in plumber jobs, training, and DIY plumbing. This is not a buyer. It is an adjacent intent clinging to the exact same word.
In SaaS, the vocabulary is narrower. Queries sit closer to the product, like feature names, integrations, and pricing. The tail is shorter, which is why the 29.6% median is lower than the 61.9% for e-commerce in this sample. I observe this logic inside the accounts. The data does not prove it. The dataset simply records that the niches diverged, and stays silent on the reasons.
What to do: five steps
Step 1. A 90-day report, sort by spend, and filter for zero conversions
Open Google Ads. Click Campaigns on the left, then Insights and reports, and finally Search terms. This report shows what people actually typed, not the keywords you bid on. Business owners confuse these all the time. Your keyword might be exact, but the query that triggered it is already about something else.
Set the date range to 90 days. Add the cost and conversions columns if they are hidden. Enable the filter for zero conversions. Sort by cost from highest to lowest. Export the table. The screen cuts off the tail, and an evening of work belongs in a spreadsheet, not in a scroll bar.
Start from the top. The first rows are your expensive empty queries. This is where your evening pays off. Do not start from the bottom, where random phrases with single cheap clicks sit. You will exhaust yourself long before you reach the real money. If the same topic repeats in different words, that is a group for step 3, not a pile of standalone negative keywords.
Step 2. Before pausing anything, check if conversions are tracking at all
A zero in the report can be a tracking zero. I have seen an account where almost every query looked like wasted spend, yet the sales rep was calling real people every day. The form worked, deals closed, but Google showed zero because the tracking code was on the wrong page. The owner was ready to cut the very vocabulary that was bringing in those deals.
Before you add a single negative keyword, check your tracking. For website tags, submit a test lead yourself and see if the conversion registers. For offline conversion imports, if a sale closes in your CRM, that result must feed back into Google Ads, otherwise every query looks empty. For phone calls, clicking a number is not yet a conversation. If you sell over the phone without importing those calls, the report stays blind to the very leads you actually need.
Here is another trap that is hard to spot right away. Look at which actions are included in the Conversions column and which sit only in All conversions. Sometimes a purchase happened, but it was excluded from the main column, making the query look empty. If the entire account shows almost no conversions over 90 days, stop right there. Fix your tracking first. Filtering for zero conversions means nothing when there is a zero everywhere.
Step 3. Group negative keywords by meaning, not by single queries
You see a row that says download free estimate template. If you exclude this exact phrase, tomorrow you will get get free estimate sample. It is the same intent, different words, and the same wasted money. Cut the topic, not the row.
Build groups. For a service you do not sell as templates, use free, download, template, sample, DIY. For job seekers, use vacancy, salary, resume, jobs, assuming you are not hiring through this campaign. For students, use essay, coursework, diploma, assuming you do not sell education. Put competitors in a separate group if you do not want to show up for their names.
Apply account-level lists to absolute junk that applies everywhere. Apply campaign-level lists when a term is trash in one campaign but a core keyword in another. Wholesale is useless for a retail campaign, but it is the main demand for a B2B one. I never dump a ready-made basic negative keyword list from the internet into an account. It cuts out other people’s niches and leaves your own costly phrases untouched exactly where you needed to use your head.
Step 4. Narrow match types where the tail is empty
After sorting out the groups, look beyond the queries. See which keywords and campaign types are spawning this tail. Broad match opens the doors wide. Performance Max opens them even without a keyword list. If a specific keyword consistently pulls in irrelevant intent with zero leads, narrow that exact keyword down from broad to phrase or exact match. Do not flip the entire account in one evening. Just the noisiest ad group.
Performance Max does not provide a full search terms report like Search campaigns do. What you can achieve in an evening is this: check your brand exclusions so the campaign does not cannibalize your name if you run brand separately, and check your negative theme exclusions if your account interface supports them. Account-level negative lists cover Search and Shopping campaigns. Performance Max uses different levers, and you must work with what the platform actually gives you, not with an imaginary full report.
Step 5. Measure again in 30 days using the same query sample
Save the export from step 1. This is your baseline. In 30 days, look at those exact same queries, not a fresh 30-day report with a brand new set of rows. Otherwise, you are comparing different vocabularies and you can prove absolutely anything to yourself.
Check if the spend dropped on the empty topics you blocked. Check if conversions appeared on the queries you left alone. See if a new junk tail emerged around the same topic. If it did, your negative keyword group was too narrow, and you need to add the broader theme, not just another single phrase.
I do not aim for zero. A zero rate often means you cut off a rare but profitable tail. Use the table above as the benchmark, according to the Ivitskiy Ads Lab panel (sample of 84 advertisers, windows 2023 to 2025): the median is 39.4% and the lower quartile is 28.0%. If you are closer to 67.0%, you have plenty to clean up. If you are already near 28.0%, further trimming is likely not your account’s top priority.
What not to do
- Do not exclude with a negative keyword a query that brought a conversion even once over a longer window: a search term cannot be paused, it is only excluded by a negative keyword. Before adding a negative keyword, open the same 90-day report without the zero filter. If there was a lead, the row is not trash, even if it has been quiet lately.
- Do not slash half of your vocabulary in one day. An evening session is for closing the most expensive empty topics, not everything that failed to buy.
- Do not measure the wasted spend rate on a window shorter than 30 days. Conversions need time to arrive, and you will end up blocking queries that just have not closed yet.
- Do not force someone else’s median onto your account. The 39.4% describes this specific sample. Your number might be different, and that is not a death sentence.
If you have no time to calculate this yourself, we can review your account in 15 to 20 minutes and give you your wasted spend rate using this exact method. The same 90 days, the same zero-conversion queries, and the same share of visible spend. No pitch decks, and no promises of how much better things will get. Just your account’s number right next to the sample table.
My e-book “19 Google Ads Secrets”: how to get the most out of Google Ads without draining your budget, drawn from real campaigns and tests.
See the book →When this does not apply
- If conversions are set up poorly, you will cut off live queries. Do step 2 first, otherwise the whole cleanup rests on conversions you cannot see.
- If your business is seasonal, a quiet month looks like wasted spend. You might cut your vocabulary right before the busy season and face the demand with holes in your keywords.
- If your account spends less than roughly $500 on search per window, a few clicks will swing the percentage wildly. That is exactly why this sample uses that threshold. Below it, the number jumps around and holds no weight.
- If sales happen over the phone without tracking, the report tells you nothing about leads, it just shows an empty column. In that case, you need to fix your call tracking, not your negative keywords.
My e-book “19 Google Ads Secrets”: how to get the most out of Google Ads without draining your budget, drawn from real campaigns and tests.
See the book →