
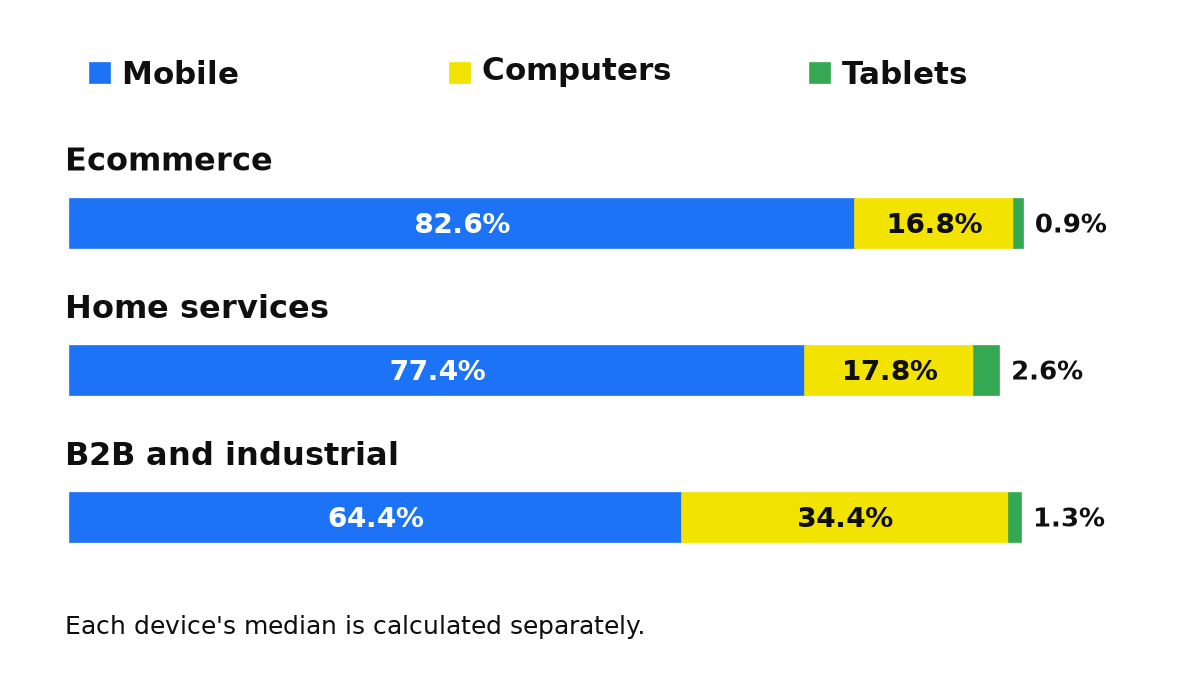
Median mobile shares of spend in our panel accounts are 64.4% for B2B and industrial businesses, 77.4% for home services, and 82.6% for ecommerce. A median is the middle of an ordered set of values; an average is their sum divided by their count.
Even in B2B, computers account for a median 34.4% of spend in the panel accounts. That challenges the assumption that business buyers make mobile an afterthought. It does not establish which device produces the best results. I use this comparison to decide what to investigate in an account before recommending a change.
Our Google Ads benchmarks hub covers click-through rate (CTR) and cost per click (CPC) by industry. This guide addresses a different question: which devices receive the spend, and what should you check next?
How much spend goes to each device?
These are median device shares of spend across all campaign types in the panel accounts from 2024 to mid-2026. A Search filter in the calculation has not been confirmed. Read them as observations from the panel, not as recommended allocations for a US or UK business.
| Industry | Mobile | Computers | Tablets |
|---|---|---|---|
| Ecommerce | 82.6% | 16.8% | 0.9% |
| Home services | 77.4% | 17.8% | 2.6% |
| B2B and industrial | 64.4% | 34.4% | 1.3% |
The rows do not add up to exactly 100%. Each device’s median is calculated separately. The totals are 100.3% for ecommerce, 97.8% for home services, and 100.1% for B2B. No row represents a particular business’s budget. Do not adjust the tablet column to make the arithmetic balance.
For a B2B owner, this is a reason to inspect the mobile landing page rather than assume the desktop experience deserves all the attention. For a store owner, I would also recommend walking through the purchase journey on a phone. I would not ask an agency to reproduce the panel’s device split without first reviewing the account’s own results.
How to check your own mobile share
Select all campaigns in your account to compare with the table, and keep the same reporting period for every device. Google’s device reporting instructions give the following route.
- Open Campaigns, then Insights and reports, then When and where ads showed. Select the Devices tab.
- Read the cost for each device. Divide mobile cost by total cost for the same campaigns and dates, then express that ratio as a percentage.
- Compare conversions and conversion rates alongside cost. Keep the spending question separate from the question of what those clicks produced.
- If your split differs from the panel, check campaign scope, dates, and your own account history before treating the difference as a problem.
- Record the bidding strategy before proposing an adjustment. Describe the problem you want to solve, such as weak mobile results, rather than simply asking for a different spend split.
When reviewing this with your agency, ask what specifically is unsatisfactory about the device’s results. “Mobile takes most of the money” is an observation that still needs interpretation. If the concern is weaker conversion performance within your account, move on to the landing page review.
Does more mobile spend mean more leads?
A separate cross-check shows why you need both views. In accounts I audited, predominantly subscription services, mobile received a median 72% of spend from September 2024 through February 2025. Yet mobile conversion rates were lower than desktop rates in about 86% of those accounts. The median relative conversion-rate gap was minus 28.6%.
The comparison was made within each account: its mobile performance against its own desktop performance. This is a relative rate difference, not a percentage-point gap or a measure of wasted budget. It is also a separate group of businesses from the industry table above. Do not combine the figures into a single benchmark.
In my practice, when mobile dominates spend, I start by reviewing the page on a phone: the call button on the first screen, the length of the form, and page speed. I recommend completing the enquiry journey yourself. For a fuller diagnostic sequence, see what to check when clicks produce no leads.
The audited landing pages from the same period offer a reason to investigate speed. Pages with mobile speed scores of 9 to 10 had a conversion rate of 3.65%; scores of 6 to 8 were associated with 1.93%, and scores of 1 to 5 with 1.28%. These score groups describe the audit; without a method for matching the scales, do not compare them directly with PageSpeed Insights scores. These are conversion rates for the whole page, not mobile visitors alone. The relationship is a correlation, not proof that speeding up your page will produce those results.
You can check mobile page speed free with PageSpeed Insights. Use the check to identify work worth discussing with your developer. Treat the study’s speed groups as research observations, not as promised conversion targets for your site.
Which device adjustments work with Smart Bidding?
According to Google’s bid adjustment rules, device adjustments range from minus 100% to plus 900%. Where device exclusion is available in your campaign, minus 100% stops ad delivery on that device. However, the range does not mean that every bidding strategy applies an ordinary manual adjustment.
With Maximize Conversions or Target ROAS, only the minus 100% device exclusion applies, provided device exclusion is available in your campaign. An ordinary manual increase or decrease does not adjust the bid. Target CPA has a different rule: a device adjustment changes the CPA target for that device, rather than the bid itself. Check that the setting is available in your campaign and review your bidding strategy before editing a percentage.
Smart Bidding already considers device as an auction-time signal. Repeatedly increasing an unsupported adjustment will not make it effective. My recommendation is to return to device performance and the landing page review. Treat exclusion as a separate business decision: it stops delivery on that device, rather than gently nudging the allocation.
You now have a sequence for reviewing device spend, the mobile page, and bidding settings. For an account review, bring those findings so we can work through your results and decide which issue deserves attention first.
Tags and reports matter when they show payback. My e-book “19 Google Ads Secrets” shows how to get the most out of Google Ads without draining your budget, drawn from real campaigns and tests.
See the book →When this does not apply
The panel does not represent the whole market, and historical medians do not forecast your future device mix. The table covers all campaign types, so do not treat it as a separate Search benchmark. Nor can a spending share tell you the share of clicks, customers, or leads.
In my B2B work, I have encountered enquiries that begin on a phone and finish later on a computer. A weaker mobile result in a last-click report is therefore not enough for me to recommend switching mobile off. I would first investigate the enquiry journey. If calls matter to your business, also review when a call tracking service is useful.
Questions and answers
What share of B2B traffic comes from mobile?
This table measures spending: the median mobile share for B2B and industrial businesses is 64.4%. It does not establish traffic share. Open your device report and examine clicks if your question concerns visits rather than dollars spent.
Should I exclude tablets because their share is small?
I would not exclude them on that basis alone. Check their results in your account. Google treats tablets as a separate device category, so keep them separate from phones when comparing your spending with the table.
Why is there no TV column?
Google’s TV category includes smart TVs, games consoles, and connected devices such as Chromecast. TV targeting is available only for Display and video campaigns. The table shows mobile, computers, and tablets across all campaign types. It has no separate TV column, so check TV spend in your own device report.
Where the data comes from
This is the same panel of agency-managed accounts used in the benchmarks hub: a convenience sample predominantly covering Eastern Europe and international SaaS, with device shares of spend across all campaign types from 2024 to mid-2026. Despite the filename, a Search filter in the calculation has not been confirmed. Business country was not recorded; only industries meeting the independent-advertiser threshold appear, with counts available in the dataset file panel_device_mix_search.csv. You can download and verify the data on Hugging Face and GitHub.