
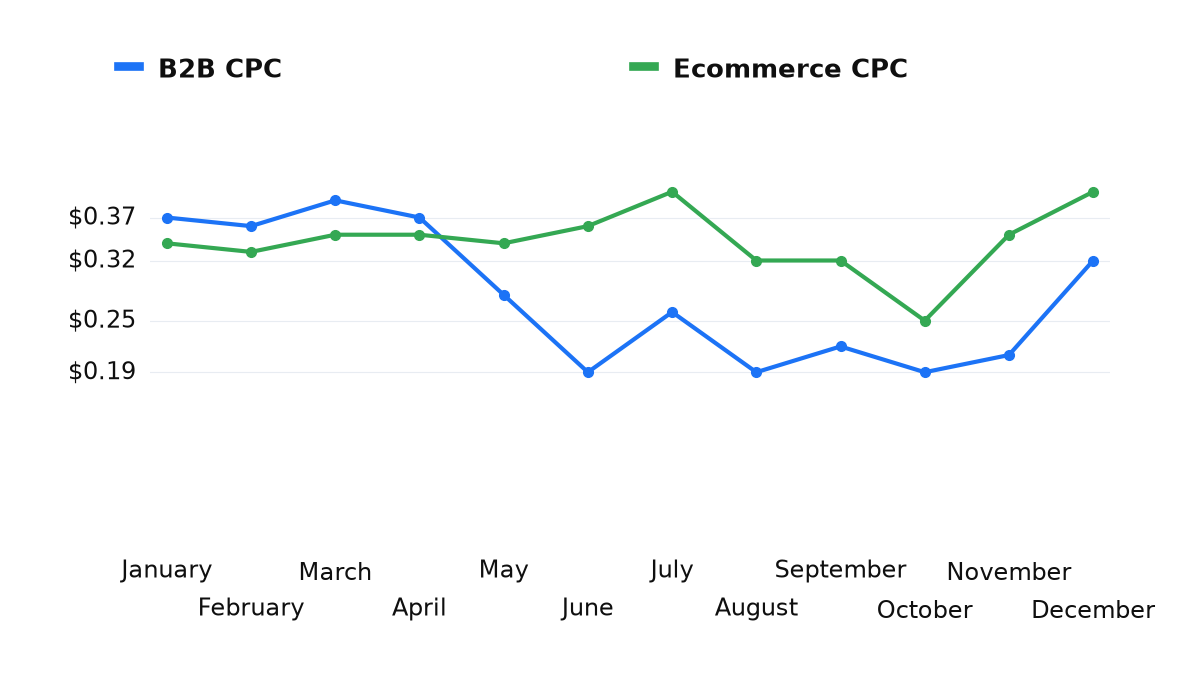
B2B and industrial search clicks in our panel cost $0.19 in June, August and October, compared with $0.39 in March; July recorded $0.26. These are medians, meaning the middle of an ordered set of values; an average instead divides their sum by their count. They describe historical observations, not a promised summer discount.
Ecommerce tells a different story. Median cost per click (CPC) ranges from $0.25 to $0.40, while click-through rate (CTR), the share of impressions resulting in clicks, ranges from 7.91% in July to 15.48% in April. The Google Ads benchmarks hub covers annual industry levels; this breakdown shows the monthly differences. Treat these dollar figures as panel observations, not price targets for a US or UK business.
When are B2B and ecommerce clicks cheapest?
The table pools calendar months from 2022 to mid-2026. It is not a sequence from the latest year. All values are medians across advertisers for search campaigns in the panel, with each advertiser counted once and CPC expressed in US dollars. Read down each industry’s columns before comparing industries. Each monthly cell includes only active advertisers meeting the impression and click thresholds, so changes in the figures may reflect changes in the panel’s advertiser mix rather than market seasonality.
| Month | B2B CPC | B2B CTR | Ecommerce CPC | Ecommerce CTR |
|---|---|---|---|---|
| January | $0.37 | 8.07% | $0.34 | 8.30% |
| February | $0.36 | 8.24% | $0.33 | 9.64% |
| March | $0.39 | 8.71% | $0.35 | 9.77% |
| April | $0.37 | 8.12% | $0.35 | 15.48% |
| May | $0.28 | 7.50% | $0.34 | 9.15% |
| June | $0.19 | 7.62% | $0.36 | 10.73% |
| July | $0.26 | 8.52% | $0.40 | 7.91% |
| August | $0.19 | 10.52% | $0.32 | 8.68% |
| September | $0.22 | 9.19% | $0.32 | 9.83% |
| October | $0.19 | 6.86% | $0.25 | 11.75% |
| November | $0.21 | 9.69% | $0.35 | 10.60% |
| December | $0.32 | 8.39% | $0.40 | 8.80% |
B2B’s cheaper period extends beyond summer: October also records $0.19. Yet August CTR is 10.52%, against October’s 6.86%. Matching prices do not imply matching click-through rates. For ecommerce, April’s CTR peak comes with a $0.35 CPC, while the cheapest clicks occur in October. There is no month that wins on every measure.
When reviewing an account, I start with a specific question: did the price of a click change, or did the share of impressions attracting clicks change? For a closer explanation of that second measure, see the guide to CTR in Google Ads.
Which changes more across months: CPC or CTR?
CPC varies more in three of the four industries with complete calendar coverage. B2B’s highest-to-lowest monthly ratio is 2.05 for CPC versus 1.53 for CTR. Healthcare records 3.45 versus 1.23. Ecommerce reverses the pattern: 1.60 for CPC versus 1.96 for CTR. These ratios compare monthly extremes, not growth from the start to the end of a year.
| Industry | Cheapest month | Most expensive month | Highest / lowest CPC |
|---|---|---|---|
| B2B and industrial | June, August, October: $0.19 | March: $0.39 | 2.05× |
| Ecommerce | October: $0.25 | July, December: $0.40 | 1.60× |
| Healthcare | August: $0.31 | November: $1.07 | 3.45× |
| Home services | January: $1.32 | October: $6.84 | 5.18× |
The home services row needs a composition caveat. Each monthly median includes only advertisers active in that calendar month and meeting the impression and click thresholds. A jump can therefore reflect different advertisers appearing in the calculation. This panel cannot separate market seasonality from changes in who was advertising.
Most home services months fall between $1.32 and $1.62. April reaches $5.70, September $6.21, October $6.84 and November $6.32, roughly four times the typical monthly level of $1.52. The strongest objection to calling this a market-wide seasonal surge is built into the method: the active advertiser mix changes. A striking chart does not resolve that uncertainty.
How should you check seasonality in your account?
In my practice, I plan budgets around the account’s own monthly history. Another panel’s curve helps decide where to investigate. It does not decide when to switch your advertising off. Here is the sequence I use before treating an apparent seasonal pattern as a budget assumption.
- Assemble your search history by month. Put CPC and CTR side by side for the years available. Mark missing periods explicitly. I would rather leave a gap than fill it with another business’s benchmark and mistake that borrowed value for the account’s own experience.
- Compare matching calendar months. Look for a recurring direction in your own history. I distinguish a repeated pattern from an isolated spike before labelling a month expensive or cheap. If the pattern does not repeat, I keep the seasonal explanation provisional.
- Investigate a sudden CPC increase. During audits, I check Auction Insights and new competitors before considering lower bids. My question is what changed in this account. “It is the season” is a hypothesis to examine, not enough evidence to close the discussion.
- Check demand seasonality separately. You can use Google Trends for that additional check. I use the comparison to question the advertising history, without substituting a demand chart for the account’s spending records or turning its shape into a predicted click price.
My test is straightforward: I drop the working assumption of a recurring seasonal spike if matching months in the account’s history do not support it. That keeps a useful benchmark from becoming an explanation imposed on every account.
The next useful step is to apply these questions to your own reports. An account review can work through your monthly history and the evidence behind a budget decision, using these tables to guide the investigation.
My e-book “19 Google Ads Secrets”: how to get the most out of Google Ads without draining your budget, drawn from real campaigns and tests.
See the book →When should you use seasonality adjustments?
According to Google Ads Help, Smart Bidding already accounts for seasonal events. Google says to use seasonality adjustments only if you expect major changes in conversion rate, such as during a short sale. They are ideal for events lasting 1 to 7 days and may work less well over periods longer than 14 days. In Search, Shopping and Display campaigns, they are available only with Target CPA and Target ROAS strategies; in Performance Max and App (beta), they are available with all strategies.
A historically cheap August is therefore insufficient reason to add an adjustment. The relevant question is whether a specific short event is expected to change conversion rate substantially. A monthly CPC table does not establish that expectation.
When this does not apply
When you need a national market norm. The panel is not representative, and business country is not recorded. For US context, LocaliQ (WordStream)’s 2026 report gives an average search CPC of $5.42 and average CTR of 6.64%. Those campaign averages describe a different sample. They should not be compared directly with our advertiser medians or treated as a UK account’s expected results.
When you need a forecast or missing months. Past medians do not promise repetition. The robustness of monthly medians to removing a single advertiser has not been checked, so the table describes the panel rather than an established pattern. Automotive covers only March, April, May, June, July and September; local services covers January, June, July and August. Other months fall below the privacy threshold. We do not draw complete seasonal curves for those industries.
Questions and answers
Should I cut my summer advertising budget?
I make that decision using the account’s own history. B2B clicks in this panel were cheaper during summer, so these observations do not support a blanket summer budget cut.
Why do clicks cost more in November?
They do not universally. November was healthcare’s most expensive month, but B2B peaked in March. Home services also requires the advertiser-mix caveat. I investigate an account’s auction competitors before settling on a seasonal explanation.
What is the best month for ecommerce ads?
October has the lowest median CPC in the panel; April has the highest CTR. These answer different questions. Neither observation alone establishes the best month for your business.
Where the data comes from
This is a convenience panel of agency-managed accounts, predominantly Eastern Europe and international SaaS, covering search campaigns only; it is not representative of the market. Calendar months are pooled from 2022 to mid-2026, with US dollar amounts converted at a fixed mid-2026 exchange rate. Cells are subject to a privacy threshold; advertiser counts by industry appear in panel_ctr_cpc_seasonality.csv in the dataset on Hugging Face and the repository on GitHub. You can download and verify the data under the CC BY 4.0 licence, but the robustness of monthly medians to removing a single advertiser has not been checked: the public files do not contain advertiser identifiers.