
Most online “calculators” come down to a single formula: divide your spend by the number of leads to get your cost per lead. Then compare it with the “market average.” This is how budgets get wasted, because the market average knows nothing about your margin, your lead-to-sale conversion rate, or how many sales you actually close from your leads.
The wider context of the system is covered in Google Ads: The Complete 2026 Guide. It is also worth seeing what PPC advertising really costs. See also how account structure works.
Before launching a campaign, you need to calculate two separate thresholds: your target CPA, which preserves the business’s planned profit, and your break-even CPA, at which the entire margin goes into marketing. Below, I show the calculation process using a real example in dollars and three numbers you need to know before you even open Google Ads.
If you are already running a campaign and do not understand why it is failing to deliver the required profitability, work through the entire chain. In most cases, the issue is not optimisation. It is that the maximum affordable cost per click was lower than the actual auction CPC from the very beginning. I cover this separately in the section “What to do when the numbers do not work.”
Three numbers you need before calculating anything
Before opening the calculator, pull three specific numbers from your own business. Not from competitors or “the market,” but from your CRM and financial reports:
- Website-to-lead conversion rate (CR1). The percentage of visitors who submit their contact details. For B2B services in Chicago, use a range from 0.8% to 2.5%. For an impulse-purchase B2C product, use from 2% to 6%. If you have not run traffic yet, use the lower end of the range. First collect at least a few hundred clicks and enough conversions, and only then compare options in an A/B test.
- Lead-to-sale conversion rate (CR2). The percentage of leads that become paying customers. The difference between 20% and 40% can destroy the entire calculation. Use the median from the last 3 months, not your “best month.”
- Margin per paying customer, in dollars. Not revenue, but what remains after fulfilment costs, logistics, the sales representative’s time processing the lead, and all other variable costs. If you use LTV, add repeat purchases separately. Otherwise, the decision will be overly optimistic.
Without these three numbers, any table showing a “recommended CPC” is just a guess.
Calculation process with a real example
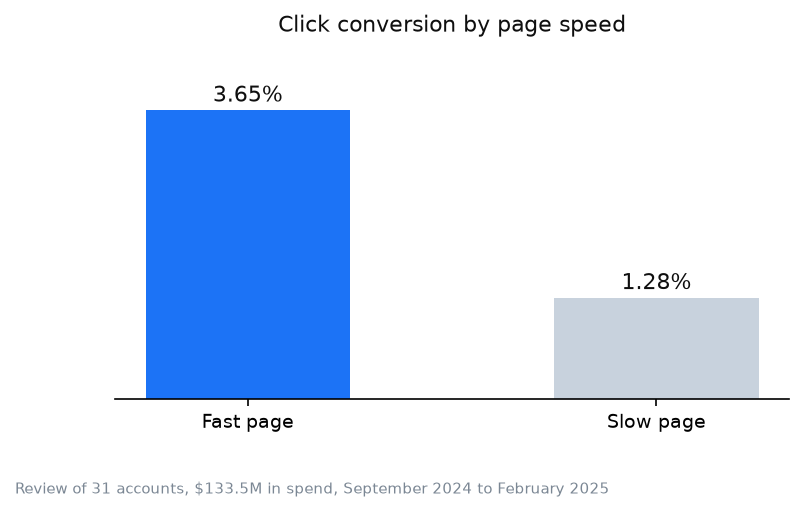
Imagine a small business offering paid legal consultations in Chicago. The average order value is $4,500, the cost of delivering the service, including the lawyer’s time, is $1,800, so the margin is $2,700. CR2 = 30%, CR1 = 1.5%.
Step 1. Choose a target number of monthly leads. For example, 40 leads. This is the number your sales representative can realistically process and close.
Step 2. Calculate the required number of sales. 40 × 30% = 12 sales.
Step 3. Calculate the revenue from those sales. 12 × $4,500 = $54,000.
Step 4. Allocate a marketing budget as a percentage of margin. There is no universal rule, but for paid services with a short sales cycle, I work with 30% to 50% of the margin contribution. Let us use 40%: 12 × $2,700 × 40% = $12,960. This is the target monthly budget. After that spend, the business retains 60% of its margin, or $19,440 before taxes and fixed costs.
Step 5. Calculate the target CPA and break-even CPA. The target CPA is $12,960 ÷ 40 = $324. At this cost per lead, 40% of the margin goes into marketing. The break-even CPA is $2,700 × 30% = $810. At this cost per lead, 100% of the margin goes into marketing.
Step 6. Calculate the target CPC and break-even CPC. The target CPC is $324 × 1.5% = $4.86. The break-even CPC is $810 × 1.5% = $12.15. The first number preserves the planned profitability. The second defines the point beyond which advertising becomes unprofitable.
Step 7. Check the expected profit. Revenue minus fulfilment costs minus the advertising budget: $54,000 − $21,600 − $12,960 = $19,440. This is the same 60% of the total $32,400 margin that should remain after marketing costs.
Here is the complete calculation:
| Step | Metric | Value |
|---|---|---|
| 1 | Target number of leads | 40 |
| 2 | Sales at CR2 = 30% | 12 |
| 3 | Revenue at an average order value of $4,500 | $54,000 |
| 4 | Budget at 40% of margin | $12,960 |
| 5 | Target CPA / break-even CPA | $324 / $810 |
| 6 | Target CPC / break-even CPC at CR1 = 1.5% | $4.86 / $12.15 |
| 7 | Target number of clicks | 2,667 |
| 8 | Target number of impressions at a 4% CTR | 66,675 |
Arithmetic check: 40 ÷ 0.015 = 2,666.67, which rounds to 2,667 clicks. At a 4% CTR, this requires 2,667 ÷ 0.04 = 66,675 impressions. Multiplying 2,667 × $4.86 gives $12,961.62, which is effectively the same as the $12,960 budget after accounting for the rounded click volume.
Now compare row 6 with the forecast from Google Ads Keyword Planner for your keywords. If the forecast CPC is above $4.86, you cannot maintain your target profitability. If it is above $12.15, the campaign does not pass the break-even point in its current configuration. This is not necessarily an optimisation problem. It may be a problem with the inputs or the economics of the offer itself.
Target CPA and the break-even point: two formulas
In words: target CPA = (average order value − total cost of fulfilment) × CR2 × share of margin you are willing to spend on marketing.
Using the numbers from the example: ($4,500 − $1,800) × 30% × 40% = $2,700 × 0.3 × 0.4 = $324.
Calculate the break-even CPA = (average order value − total cost of fulfilment) × CR2 separately.
For our example: ($4,500 − $1,800) × 30% = $2,700 × 0.3 = $810.
So $324 is the target profitable CPA, not the break-even point. If the actual CPA is, for example, $500, the campaign is above the target level but remains profitable because $500 is less than $810. Stopping it as unprofitable simply because it exceeded the $324 threshold would be a mistake.
If your numbers do not line up, check CR2. That is almost always where the problem lies.
What to do when your affordable CPC is below the market CPC
This is where things get interesting. You calculate a target CPC of $4.86 and a break-even CPC of $12.15, but Keyword Planner shows from $18 to $25 for your keywords. There are four practical responses, ranked by what delivered results in our sample:
- Change the keywords, not the campaign. Move from expensive commercial search terms to long-tail and problem-focused phrasing. CPC can be two or three times lower there.
- Change the location targeting. Major cities tend to deliver higher conversion rates but also higher CPCs. If your business serves customers across the United States, test smaller metropolitan areas in separate campaigns.
- Increase the average order value or CR2. This is rarely a quick fix, but it is the only legitimate way to enter a more expensive auction.
- Increase the budget in an attempt to “outspend” competitors. This is where you should stop.
Based on our analysis of $133.5 million in spend, budget is almost never the constraint at the $1M+ scale: 61% of lost impression share, or lost IS, comes from low Ad Rank, while the median loss caused by budget constraints is only around 0%. Simply giving Google more money does not mean you will get more clicks. The auction is determined by ad quality, expected CTR, landing page relevance, and bid, not by the size of your budget. If your Ad Rank is not competitive, more money will only buy the same clicks at the same price faster.
This is also consistent with how Google describes ad ranking in its official documentation: it is based on a combination of the bid, ad quality, and Ad Rank thresholds, not the size of the budget.
When this does not apply
This calculation is not suitable when:
- You do not have a stable lead-to-sale conversion rate in your CRM. If CR2 fluctuates from 10% to 40% month over month, any affordable cost per lead will be arbitrary. Stabilise the funnel first with consistent call scripts, a fixed lead response time, and lead quality control.
- You sell complex B2B services with a sales cycle from 6 to 18 months. In that case, calculate the cost per qualified lead and the expected probability of closing at each stage instead of CPA. The formula still works, but with different inputs.
- Your business depends heavily on repeat purchases, but you do not account for LTV. You will underestimate the affordable CPA and conclude that the auction is too expensive when it may actually work for your business.
- You have not run advertising yet and have no baseline for CR1. Use the lowest pessimistic value and allocate a test budget large enough to collect at least a few hundred clicks and enough conversions. Do not draw conclusions just because two weeks have passed.
In short, the calculator gives an honest answer only when the input numbers come from your business, not from someone else’s case studies.
FAQ
How do I calculate website conversion if I have not run ads yet?
Use data from organic traffic or paid traffic from channels that are already active. If you have no data, use the lower end of the industry range and add from 30% to 50% as a buffer for a pessimistic scenario. Before comparing options, collect at least a few hundred clicks and enough conversions. The passage of time alone does not make a sample reliable.
What conversion rate is considered normal for an online store?
For US e-commerce with a product feed and a solid landing page in 2025-2026, use from 1.5% to 3.5% for a lead or add-to-cart conversion and from 20% to 35% from cart to payment. A lead conversion rate below 1% indicates a problem with the page, not the traffic.
What is an affordable cost per lead, and how is it different from the actual cost per lead?
This calculation has two affordable thresholds. The target CPA shows how much the business can pay for a lead while preserving the planned share of profit. The break-even CPA shows the maximum cost per lead at which the entire margin goes into marketing. In our example, these are $324 and $810 respectively. The actual CPA shows what Google Ads delivered during the reporting period. You need to compare it with both thresholds.
Can I use the average market CPC instead of Keyword Planner?
No. An average market CPC combines data from your competitors and completely different niches. Keyword Planner gives you a forecast for your specific location, device, and impression share. It is a tool, not a benchmark.
Tags and reports matter when they show payback. My e-book “19 Google Ads Secrets” shows how to get the most out of Google Ads without draining your budget, drawn from real campaigns and tests.
See the book →Sources
- Google Ads Help: “Ad Rank”: https://support.google.com/google-ads/answer/1722122 (accessed: August 2026)
- Google Ads Help: “About conversion goals”: https://support.google.com/google-ads/answer/10995103 (accessed: August 2026)
- Google Ads Help: “Get impression share data”: https://support.google.com/google-ads/answer/7103314 (accessed: August 2026)
- Google Ads Help: “About Smart Bidding”: https://support.google.com/google-ads/answer/7065882 (accessed: August 2026)
- Think with Google: “From search to sale: understanding the conversion path”: https://www.thinkwithgoogle.com/marketing-strategies/search/ (accessed: August 2026)