
ROAS measures the conversion value attributed to advertising against the cost of that advertising. If ads produce $5 in sales for every $1 spent, ROAS is 500%. That result does not prove the business made a profit.
A good ROAS is a number above your own break even threshold, not an average copied from your industry. Gross margin sets that threshold. A business with a 25% gross margin needs at least 400% ROAS, while one with a 60% gross margin breaks even at 167%. A service business must also convert a lead into expected monetary value before the calculation means anything.
What is ROAS in plain English?
ROAS stands for return on ad spend. It compares the value assigned to advertising conversions with the cost of the ad interactions that generated them.
In Google Ads, the closest ready-made metric is “Conv. value / cost.” Google’s official definition says it divides total conversion value by the total cost of ad interactions.
The word value matters. Google cannot see your bank account or infer the cost of delivering a service. It uses the conversion values the advertiser reports. ROAS can guide ad decisions, but it is not a profit statement.
What is the ROAS formula, with an example?
The formula is:
ROAS = conversion value / advertising cost × 100%
Google’s official Target ROAS example divides $5 in sales by $1 in ad spend and produces a 500% target. The same result can be expressed as a multiple of 5.
Use the same period, currency, and campaign scope on both sides of your calculation. The numerator should contain sales or another business value actually associated with those ads. The denominator should contain the ad cost for the same campaigns. Dividing total company revenue by one campaign’s cost produces a valid equation with an invalid answer.
How is ROAS different from ROI and DRR?
ROAS, ROI, and the advertising cost ratio known as DRR answer different management questions. ROAS isolates advertising efficiency. ROI looks at profit after costs. DRR shows the share of attributed revenue consumed by advertising.
| Metric | Formula | Question it answers | What it misses on its own |
|---|---|---|---|
| ROAS | Conversion value / ad cost × 100% | How much value did each advertising dollar produce? | Cost of delivery, overhead, and actual profit |
| ROI | (Revenue minus cost of goods sold) / cost of goods sold × 100% | Did the investment produce profit after costs? | The specific contribution of ads without separate attribution |
| DRR | Ad cost / revenue × 100% | What share of attributed revenue did advertising consume? | Cost of delivery and overhead |
Google’s official ROI formula subtracts costs from revenue and divides the result by costs. ROAS subtracts nothing. A strong ROAS can therefore coexist with a weak ROI.
DRR is the mathematical inverse of ROAS only when both metrics use the same revenue, date range, and advertising cost. If Google Ads contains estimated lead values while finance records paid invoices, converting one ratio into the other is misleading.
What is considered a good ROAS?
Google does not publish an official table of average or median Google Ads ROAS by industry. Its documentation explains the formula, conversion values, and Target ROAS bidding, but it does not declare a universal benchmark for clinics, law firms, repair businesses, schools, or online stores.
The benchmark tables found in search results answer a different question: what one selected group of advertisers reported under one methodology. For example, the public Triple Whale Google Ads benchmark covers more than 18,000 ecommerce brands. It describes that ecommerce sample. It does not establish a financial target for a service firm with a different margin, sales cycle, brand demand, refund pattern, or method of assigning conversion value.
A good ROAS must pass two tests. It sits above the break even threshold created by your gross margin. It also leaves enough contribution to cover costs that are invisible inside Google Ads and deliver the required profit. An industry benchmark can provide context, but it cannot set your target.
How do you calculate break even ROAS from gross margin?
Gross margin is the share of revenue left after the variable cost of delivering the order, before advertising cost. Advertising breaks even when that gross contribution equals the ad cost. The formula is:
Break even ROAS = 1 / gross margin
| Gross margin | Break even ROAS | Interpretation |
|---|---|---|
| 25% | 400% | Below this level, gross contribution does not cover advertising |
| 60% | 167% | At this level, gross contribution only covers advertising |
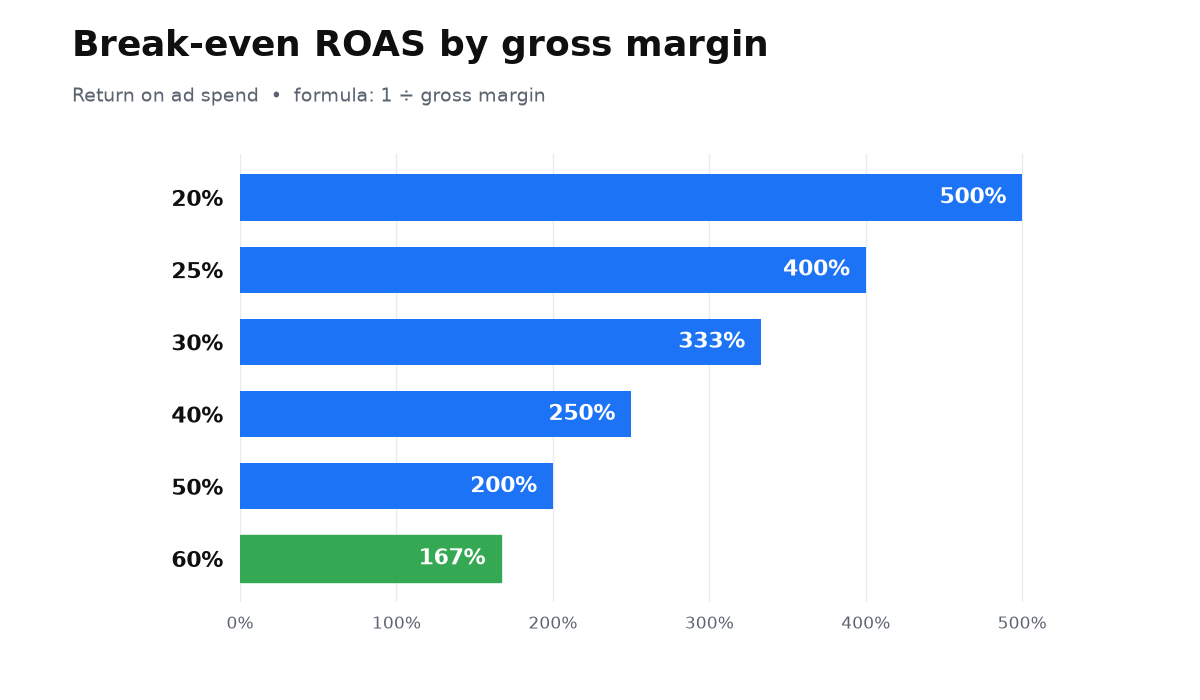
Breaking even is not the same as reaching a useful business target. At the threshold, no room remains for desired operating profit, overhead, cancellations, or measurement error. Set the working target above the threshold using your financial plan, not someone else’s case study.
Why does ROAS not work automatically for every business model?
ROAS fits ecommerce naturally because a purchase has a price that can be sent at checkout. A service conversion is often a form, phone call, or appointment request. It is not revenue yet. Some leads are unqualified, some do not attend, and some deals close much later.
A service business can estimate lead value with this equation:
Expected lead value = average revenue from a closed deal × lead-to-sale close rate
Take average revenue from paid deals and calculate the close rate from mature CRM cohorts. Do not estimate it from memory. If services have materially different prices or close rates, separate their conversion actions. Giving every form the same value encourages Google to find the easiest forms, not necessarily the most valuable customers.
The stronger method is to import the actual revenue or margin from each closed deal back into Google Ads. The expected-value formula is a practical fallback until that integration exists. If the business cannot connect leads to sales, it cannot yet calculate an honest ROAS.
Where does Google get conversion value?
The advertiser provides it. Google can receive a fixed value configured for a conversion action, a transaction-specific value from the website, or an imported value from a closed sale. Google’s conversion value documentation explicitly lists sales revenue and profit margins as possible values.
- Fixed value. Every qualified lead receives the same expected amount.
- Dynamic value. The site sends the amount of the individual purchase.
- Imported value. The CRM returns the revenue or margin of the actual closed deal.
Also inspect which actions are primary conversions. If a page view or another micro conversion carries a monetary value and is treated as primary, Target ROAS can efficiently maximize the wrong outcome.
Why is ROAS in Google Ads higher than cash collected?
Google Ads reports submitted conversion value. Your payment system reports collected money. The two diverge when they describe different events, dates, or rules for assigning a sale.
- a lead receives the full deal value even though only a share of leads close;
- cancellations, refunds, and unpaid invoices remain inside reported conversion value;
- one purchase is recorded more than once;
- Google’s attribution model credits ads while the CRM uses another rule;
- brand demand and returning customers are included as advertising revenue.
Reconcile individual deals, not just totals on two dashboards. For each deal, compare source, ad interaction, payment status, revenue, margin, cancellation status, and attribution rule. A high dashboard ROAS is trustworthy only when those records can be traced to money collected.
You now have a business-specific control system instead of a borrowed benchmark: expected lead value, actual ROAS, a margin-based threshold, and reconciliation with paid deals. The useful next step is to locate the exact handoff between ad click and gross profit where value is being lost.
My e-book “19 Google Ads Secrets”: how to get the most out of Google Ads without draining your budget, drawn from real campaigns and tests.
See the book →How do you set Target ROAS, and why add a safety margin?
Target ROAS asks the bidding strategy to maximize conversion value while trying to keep average conversion value per cost near the target. It is an optimization instruction, not a guarantee of profit or an exact outcome in every campaign.
In our descriptive dataset from September 2024 through February 2025, only 27% of campaigns met or exceeded their own Target ROAS. The median actual-to-target ratio was 0.86. The sample contained 622 campaigns with approximately $16.9 million in combined spend. Absolute ROAS values cannot be compared across these accounts because each advertiser defined conversion value. The valid comparison is each campaign’s result against its own target.
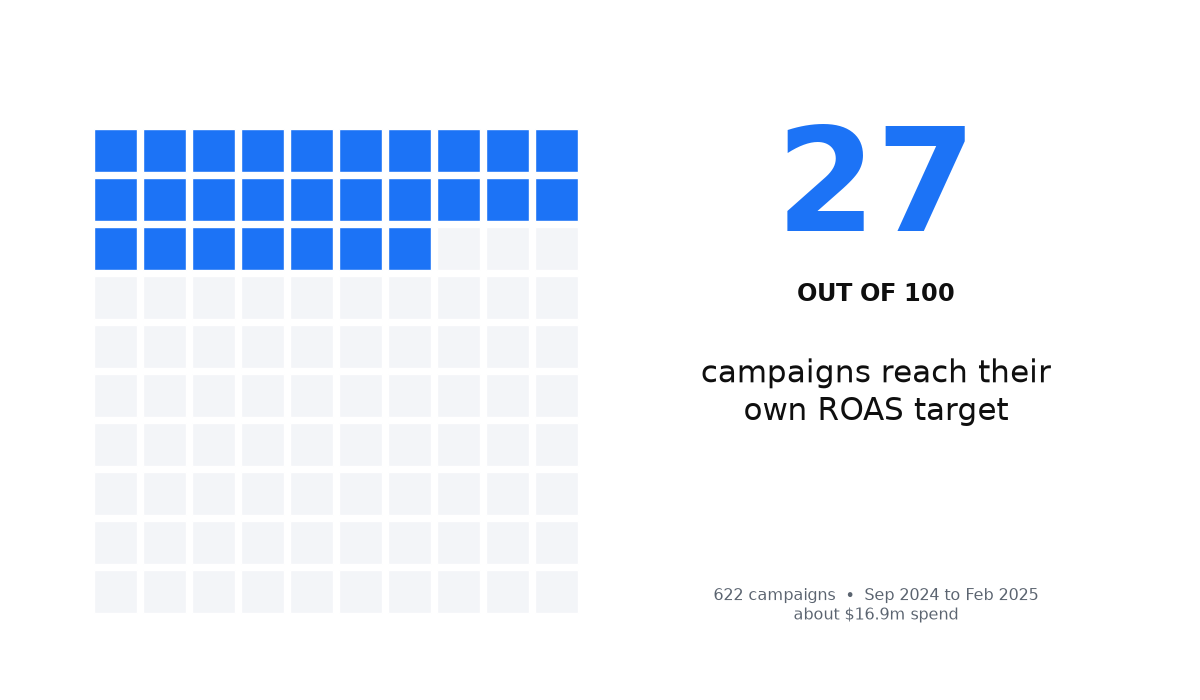
A target set exactly at break even becomes a loss whenever actual performance falls short. Add room for required profit and measurement error. Do not set an unrealistically high target just because it looks financially safe, since the strategy may sharply restrict traffic.
- Calculate break even ROAS from gross margin.
- Add required profit and a realistic allowance for the gap between reported value and collected cash.
- Confirm that primary conversions send the right business value.
- Compare actual ROAS with the target after deals mature, not from fresh leads.
For Search and Shopping campaigns, Google’s stated eligibility requirement is at least 15 conversions in the past 30 days at the conversion tracking level. Even after that threshold is met, signal quality matters more than a raw count. Incorrect value teaches automation to scale incorrect economics.
When this does not apply
- Leads cannot be connected to payments. Average deal revenue and close rate cannot be verified, so lead value remains a guess.
- The sales cycle has not matured. Ad cost is already visible while revenue will arrive later. Early ROAS systematically understates the result.
- The objective has no direct monetary value. For reach, a new category launch, or offline influence, ROAS can be supporting evidence but not the main decision metric.
- Margins vary materially. One threshold cannot represent services or products with different delivery costs. Segment them or pass margin as conversion value.
- Advertising is not the sole cause of a sale. Brand demand, returning customers, and other channels may receive ad credit. Reported ROAS is not the same as incremental impact.
ROAS questions business owners ask
Does 500% ROAS mean 500% profit?
No. It means five units of reported conversion value for every unit of ad cost. Profit requires subtracting delivery costs and other expenses.
What is the average ROAS for my industry?
Google publishes no official industry table. Public samples depend on business model, margin, attribution, and how advertisers define value. Calculate your own break even threshold first.
How should a service business calculate ROAS?
Multiply average revenue from a closed deal by the measured lead-to-sale close rate. This produces expected lead value. Replace the estimate with actual CRM revenue when possible.
Why can Google Ads show ROAS when conversion value is wrong?
The platform can divide ad cost into any submitted value. The existence of a ratio does not prove that the numerator represents revenue or margin.
Should Target ROAS equal break even ROAS?
That is risky. Actual performance can fall below the target, and break even leaves no desired profit. The working target should account for both.