

SMX Advanced Europe 2026, the vendor-independent expert-level search conference, took place on September 30, 2026, in Berlin, at the Meliá Hotel. In the PPC track of day two, Igor Ivitskiy, PhD in mathematical modeling and founder of Doctor Ads, took the stage in hall Barcelona 2.

Stop asking which number is true. Ask which question it answered.
| Conference | SMX Advanced Europe 2026 (Rising Media) |
| Date | September 30, 2026 |
| City and venue | Berlin, Germany, Meliá Hotel Berlin |
| Session | PPC track, day two, 15:00–15:45, hall Barcelona 2, moderated by Anu Adegbola (Search Engine Land, PPC Live UK) |
| Talk | “The Lies Your Data Is Telling You: 6 Statistical Failure Modes in Large-Scale Google Ads” |
The talk was built for the audience SMX Advanced is known for: specialists from large companies running serious budgets, people who already know how campaigns work and want to know why the numbers still mislead them. Igor packed 19 years of Google Ads into nine lessons: “Nine lessons I paid for, and you can use it without spending budget on these lessons.” Most examples on screen were worked examples with made-up numbers and realistic proportions, so the patterns matter more than the exact figures.
Same numbers, different picture, different decision
One business, one month, five systems: Google Ads shows ROAS 6.1, GA4 shows 3.8, the CRM says 4.4, the attribution tool claims 5.2, and finance counts 3.1. The first reflex is that something is broken. Igor opened with a gentler example: he had checked three weather websites for Berlin that same day, and they promised sun, heavy rain and clouds at once. They are not broken. They use different methodologies to process the same data, and each dashboard answers its own question honestly.
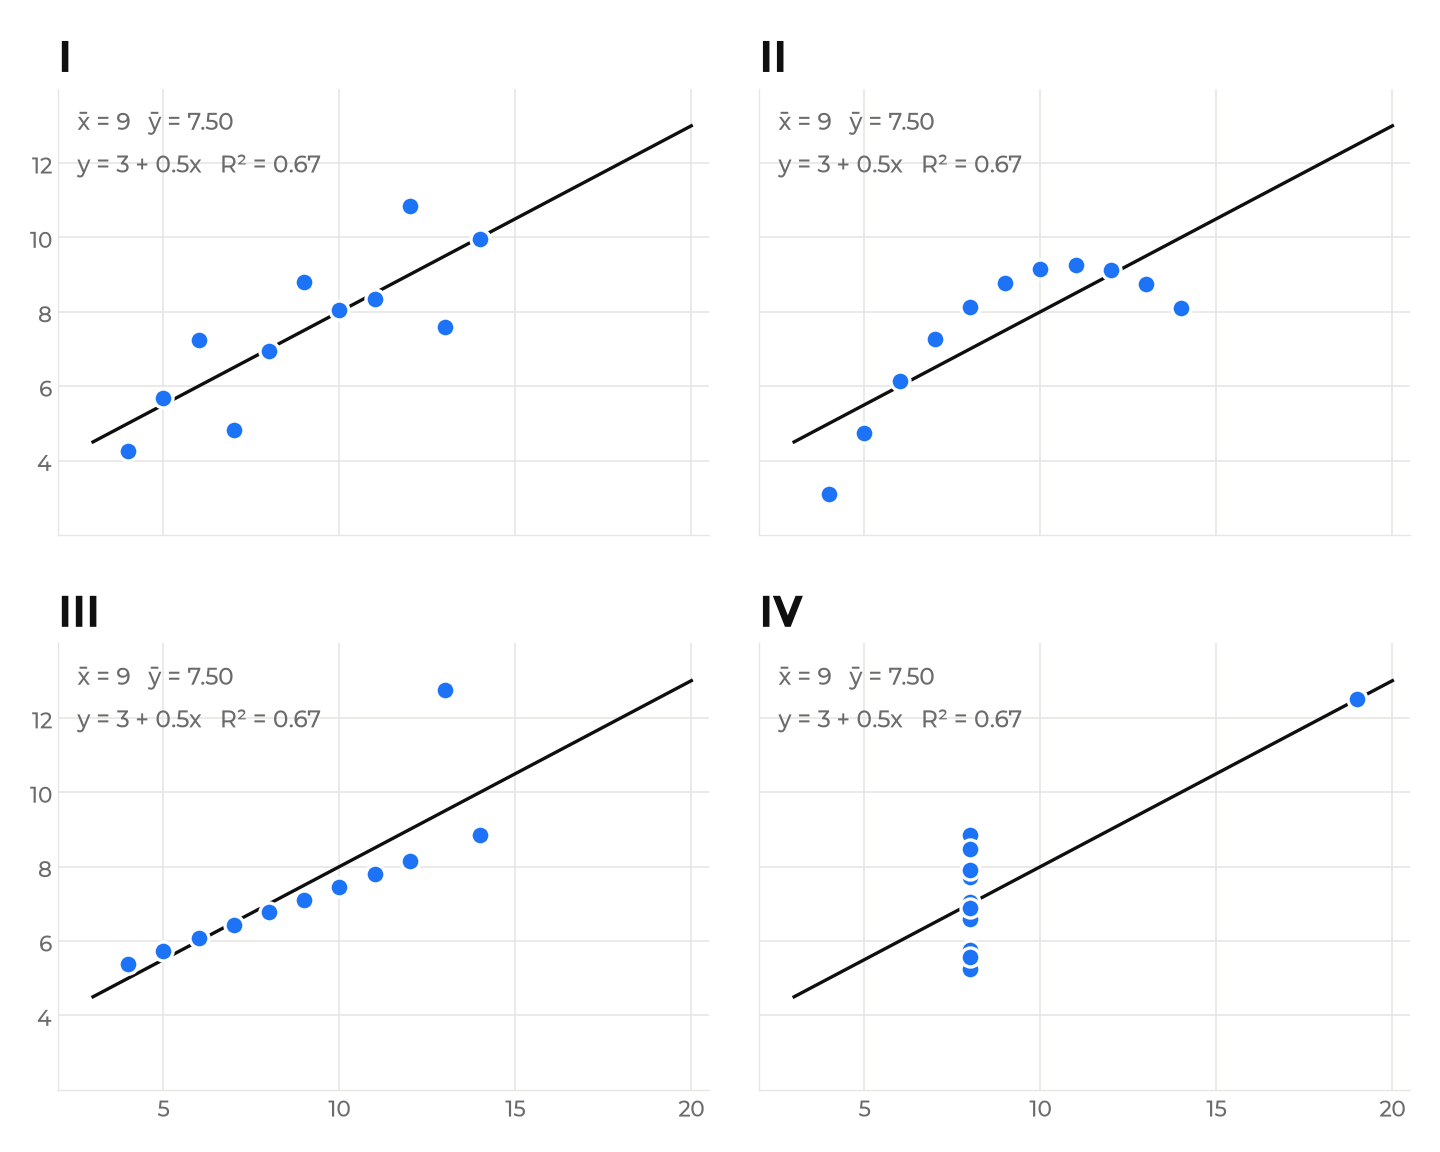
Then he moved to Anscombe’s quartet, four data sets built by statistician Francis Anscombe in 1973. All four share the same trend line, y = 3 + 0.5x, the same R² of 0.67 and the same mean, yet the raw points behind them tell four completely different stories, and each story demands a different decision. That is the spine of the whole talk: the summary statistic can stay identical while the reality underneath it changes completely.
Winners chosen by luck, significance stars that measure data size rather than profit, and modeled conversions quietly reshaping market rankings.
A stable CPA can hide shrinking acquisition, a rising ROAS can hide a warmer audience mix, and a promo spike can be borrowed from the next two weeks.
Brand ads judged without competitor pressure, targets met on average while parts of the budget burn, and budget plans built on average ROAS.
Every lesson ends with a rule for a decision: who gets extra budget, when to stop scaling, which brand campaign to pause-test first. The mechanics of each rule are walked through in the full recording.
Stop asking which number is true. Ask which question it answered, because same numbers can have different pictures and different decisions.
Igor Ivitskiy, SMX Advanced Europe 2026
My rule after 19 years in Google Ads
My biggest point is always the same: never look at the whole number, always dive deeper into detail. A difference in the shares between a few subsystems inside one campaign can change the result in a completely unexpected way, so I split the data before I believe it.
This way of reading an account, evidence first and dashboards second, is what Igor teaches his students: split the data before you trust the total.
My e-book “19 Google Ads Secrets”: how to get the most out of Google Ads without draining your budget, drawn from real campaigns and tests.
See the book →Key insights
- A stable CPA can hide shrinking acquisition. Twelve months at €50 CPA and 2,000 purchases looked perfect, but new customers fell from 1,400 in January to 700 in December, and the cost of a new customer doubled from €71 to €143.
- A winner with few conversions is often just lucky. The best campaign showed ROAS 3.9 on 36 conversions against an account average of 3.0, and that lead sat inside the range where pure luck operates; Igor’s rule of extra budget only outside the luck range connects to the analysis of whether Smart Bidding really hits your target.
- Significant is not important. A display test on 24 million impressions moved CTR from 0.50% to 0.51% with a winner star, worth €720 a month, while a test with no star was worth €7,200.
- Brand ROAS is highest where nobody competes. Sweden showed 22.4 with zero competitors bidding on the name; after adjusting for competitor pressure, Germany won. Ranking brand campaigns by auction insights pressure beats ranking by reported ROAS.
- A target met on average says nothing about the parts. One campaign hit 406% against a 400% target ROAS while 40% of its budget sat in product groups below break-even.
- Judge the next €50K, not the average. The first chunk earned ROAS 5, the next earned 3, one more earned 2, below the break-even of 2.5 at a 40% margin; this is the saturation logic behind any target ROAS bid strategy.
Key moments from the talk
One business, one month, five ROAS
Igor started where every marketer starts: five dashboards, five different ROAS values for the same month, and the itch to fix tracking. His twist was the weather. Three Berlin forecasts for that very day disagreed completely, sun, heavy rain, clouds, yet nobody calls a weather site broken. Different methodologies process the same raw data, and the same is true of Google Ads, GA4, a CRM and the finance report. Five honest answers to five different questions. From there he walked the room through Anscombe’s quartet: four data sets with identical equations and identical R² values, and utterly different shapes behind them. The lesson from 1973 landed in 2026 budgets: the curve Excel draws for you is a summary, and summaries can hide the decision you actually need to make. Five days earlier, at PPC.London, Igor had asked which campaigns are lucky and which take credit for sales that would happen anyway; the Berlin talk went one level deeper into the statistics behind those questions.
When a winner is just lucky
The first bucket was about the number itself. A thousand people flip a coin ten times each; about one of them gets ten heads in a row, and then writes a book about his method. Accounts work the same way: the best of many campaigns is also the luckiest. On Igor’s graph, the champion campaign with ROAS 3.9 on 36 conversions sat inside the grey band where luck alone can push a result, while a quieter campaign with 800 conversions stood outside it, real. Then came a distinction worth writing down: “Significant means the difference is real. It never means it is big enough.” A headline test on 24 million impressions earned its winner star by moving CTR from 0.50% to 0.51%, worth €720 a month, while a landing page test with no star was worth €7,200. Rank tests by euros, not by stars.
Highest reported ROAS is when nobody competes with us, because those clicks would come anyway.
Igor Ivitskiy, SMX Advanced Europe 2026
The third failure mode came with a dinosaur. In the 1820s British scientists assembled an iguanodon from a few teeth and one spike, and put the spike on its nose; fifty years later the horn turned out to be a thumb. Right bone, wrong place. The conversions column is a reconstruction too: observed conversions plus modeled ones in a single number. Germany showed the best reported CPA at €46, but 30% of its conversions were modeled; recounted on observed conversions only, the UK won. The truth sits in between, and the column does not say where. Igor’s fix is to rank markets twice and move budget only when both rankings agree, and he walked through the exact order of checks step by step on stage.
Who bought, and what the next euro brings
The buyers bucket held the quietest problem of the talk. Twelve months of green: €100K spend, 2,000 purchases, €50 CPA, the dream. Inside those identical months, new customers had fallen from 1,400 to 700, so a new customer now cost €143 instead of €71. Because this year’s new customers are next year’s returning ones, half the new customers this year means half the returning customers next year, a hole that appears twelve months late. The mirror image was the non-brand search campaign whose ROAS grew from 3.2 to 3.9, up 22%, while both of its audience groups got worse: the share of spend on people who already knew the brand had quietly doubled from 20% to 40%. More money went to people who were going to buy anyway.
The money bucket ended with a café. Revenue per hour by day of the week shows one golden hour, Wednesday 14:00 to 15:00, and the only logical optimization is to open one hour a week. Then Igor closed the loop from his opening example: the plan had counted on average ROAS 4, “the plan counts on 4, but the last 50K in our already used budget earned ROAS 3.” Chunk by chunk, the first €50K earned 5, the next earned 3, and one more earned 2, below break-even at a 40% margin. Average ROAS after the increase still looked fine at 3.3, while the extra €50K had actually brought €100K of revenue and minus €10K of profit. Average ROAS mixes your best euros with your last ones; the decision should be made at the margin. Full recording of this talk is part of the bonus pack for our students.

Third-party traces
Key takeaways
Before you believe a number, ask which question it answered: the same figure can hide four different pictures.
A stable CPA, a growing ROAS and a met target can all conceal shrinking acquisition, a warmer audience mix and losing product groups.
Nine questions and nine fixes turn the dashboard from a source of comfort into a diagnostic tool.
Other talks
All of Igor's other conference talks are collected on one page: where else Igor Ivitskiy has spoken.