

International Search Summit Barcelona 2025 took place on November 13, 2025 in Barcelona, Spain. The talk was given by Igor Ivitskiy, a PhD in mathematical modelling and the founder of Doctor Ads, who has spent 19 years applying mathematics to Google Ads budgets.

Why polish the 80% to perfect it instead of finding the lever that gives you much better results?
| Conference | International Search Summit Barcelona 2025 |
| Date | November 13, 2025 |
| City and venue | Barcelona, Spain |
| Organiser | TransPerfect Digital |
| Format | ~26-minute talk, English |
| Talk | “Decoding Google Ads with a Mathematician’s Lens: 3 Data-Driven Frameworks for Global Scale” |
The talk is for performance marketers, agency owners and in-house teams who are scaling campaigns across borders and feel crushed by the volume of “best practices” advice. It is for those who suspect that the numbers already in their accounts have more to say than their dashboards are reading out of them.
Why mathematics is a lever, not a tip
Ten years ago, marketers had a shortage of data. Today, the opposite is true: there is more performance data in a mid-sized account than any human can read. The standard response, Igor argued from the stage, is to ship more “best practices”: build a custom attribution model, run 24/7 multivariate landing-page tests, integrate a predictive LTV model for bidding, develop a proprietary in-house bidding algorithm. For most teams, none of that is actually buildable.
The honest question is how to process the data that is already there. Igor pointed to Vilfredo Pareto, the economist who observed that 80% of consequences come from 20% of causes. “Why should we polish the 80% to perfect it instead of just find the lever that can give you much better results?” Mathematics, in his framing, is that lever. It does not produce tips. It identifies the 20% that moves the account.
The three frameworks he shared on stage are concrete examples of that approach: a six-digit cultural code for any new market, a public-data map of where to advertise and where not to, and a word-level view of search demand that exposes two kinds of waste at once. Each is built from data the account, the market, or a public register already contains.
Use Geert Hofstede’s six cultural dimensions as a numerical coordinate when localising a new market.
Replace blind income targeting with public, location-based data on real earnings.
Treat each word in your search-term report as a separate unit, first by profitability, then by click-through rate.
Stop patching symptoms with best practices; find the root cause in the data.
Why should we polish the 80% to perfect it instead of just find the lever that can give you much better results?
Igor Ivitskiy, International Search Summit Barcelona 2025
How I enter a new country
I enter a new market with a cultural coordinate, not a guess. Hofstede’s six dimensions give me, in numbers, how a culture responds to authority, to risk, to group pressure, to long horizons. The numbers decide the brief. Everything else follows.
None of this needs a data science team. It needs the habit of asking the account, the market and public registers a precise question before spending another dollar. That habit is what Igor teaches in his courses.
My e-book “19 Google Ads Secrets”: how to get the most out of Google Ads without draining your budget, drawn from real campaigns and tests.
See the book →Key insights
- Data overload, not data scarcity, is the real problem. Ten years of “more data” advice has produced tools most in-house teams cannot actually build.
- A culture can be read as six numbers. Geert Hofstede spent 40 years, ran 100,000+ surveys across 90+ countries, and reduced culture to six dimensions: power distance, individualism, masculinity, uncertainty avoidance, long-term orientation, indulgence.
- Walmart’s $1 billion loss in Germany is the textbook case. In the widely reported story, the chain brought US store habits to Germany, where staff handled customers’ groceries and chatted with them while they shopped, and left with about a billion dollars in losses.
- Public benefit data beats blind income targeting. When up to 99% of household-income targeting comes back “unknown,” the US Social Security Administration publishes benefit data by ZIP code: the basis of a location-based profitability map.
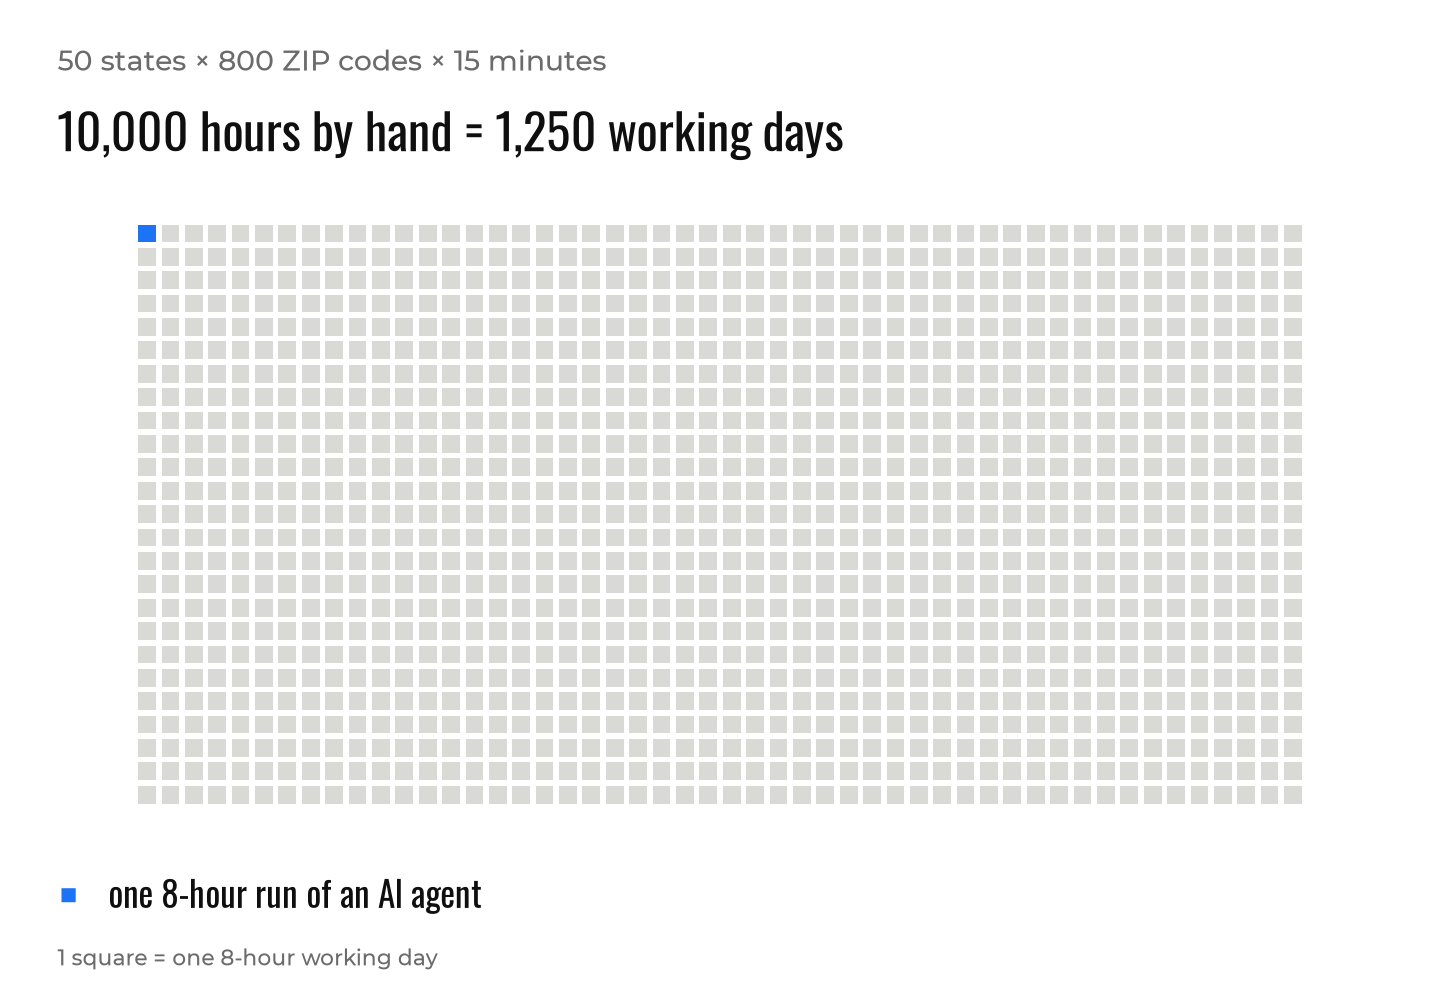
- 50 states × 800 ZIPs × 15 minutes equals 10,000 hours of manual work. A multi-hour AI agent does the same job in 8 hours and produces a ready-to-upload exclusion and targeting list.
- Search terms carry two n-gram edges. The first (CPA) produces thousands of negative keywords and typically usually lifts efficiency by 30 to 60%. The second (CTR) starts a chain reaction through Quality Score, cost per click, average rank, and back to CTR.
Key moments from the talk
The “best practices” trap
Marketing advice has not become more useful as data has become more abundant. The volume of “best practices” has grown with the volume of data, and most of it no longer applies to a typical in-house team. Igor listed the usual recommendations from the stage: build a custom attribution model, run 24/7 multivariate landing-page tests, integrate the full MarTech stack with custom APIs, implement a predictive LTV model for bidding, develop a proprietary in-house bidding algorithm. Each item is a multi-year project; few teams can attempt even one. The advice, in his framing, is a list of expensive hobbies that distract from the data the account already has.
He proposed Pareto’s principle as the corrective. 80% of the result comes from 20% of the activity, and mathematics is the tool that finds that 20%. The same data that feels overwhelming becomes legible once the analyst stops polishing the long tail of tips and starts looking for the actual lever. The three frameworks that follow are concrete examples applied to three different problems in international PPC.
From cultural guesswork to a numerical coordinate
The first framework, the Cultural Thermostat, targets the most common failure of international expansion: launching into a new country with a translated version of the home-market brief. Igor cited Pampers in Japan, where the stork-with-baby visual had to be replaced because the local explanation for where babies come from involves a child found in a big peach in the garden. He also cited Walmart in Germany, a publicly documented case in which the chain pushed US store culture onto German shoppers for years and exited with roughly one billion dollars in losses.
The quantitative move came from Geert Hofstede, a Dutch researcher who spent forty years running more than 100,000 surveys across 90+ countries. He reduced every national culture to six dimensions: power distance, individualism, masculinity, uncertainty avoidance, long-term orientation, and indulgence, and published a numerical score for each country on each. The result is a six-digit cultural coordinate that any advertiser can use to brief an agency, a copywriter, or an AI tool. Igor described a prompt that rewrites a Spanish creative for a German audience by feeding the model the difference between the two countries’ scores. Months of localisation work, in his example, compress into minutes. See also our piece on adapting Google Ads for the US and Europe for related targeting considerations.
Public data against blind targeting, and two edges of one n-gram table
The second framework, the Profitability Map, answered a different question: when Google cannot tell you who saw your ad, how do you decide where to advertise? Igor gave two financial-niche examples. In one, a webinar campaign delivered thousands of low-cost registrations but not a single investor; the algorithm optimised for form-fills rather than buyers. In another, 98% of leads asked a “quick question” rather than booking a paid consultation. Household-income targeting looked like a fix until the segment came back 99% “unknown.” The work-around came from public data: the US Social Security Administration publishes benefit recipients by ZIP code, and the share of recipients is a strong income proxy. Manually grouping 50 states × ~800 ZIPs × 15 minutes each would take 10,000 hours; a multi-hour AI agent does the same job in 8 hours and produces a ready-to-upload exclusion or targeting list.
Mathematics is your differential diagnosis. It finds the root cause to make your ads healthy.
Igor Ivitskiy, International Search Summit Barcelona 2025
The third framework, the N-Gram Double-Edge, was the one that earned Igor the PPC Caesars Award at ADworld Experience 2024 (the case is on the school blog). The first edge is word-level profitability: split every search term into its component words, sum cost and revenue per word, and turn the unprofitable words into negative keywords. In accounts with millions of search terms, the analysis takes hours and typically usually lifts efficiency by 30 to 60%. The second edge uses the same n-gram table but ranks words by click-through rate; excluding the low-CTR words starts a chain reaction through Quality Score, cost per click, average rank, and back to CTR. The full procedure is in the recording; the strategic idea is that one well-built table reveals two kinds of waste at once.
Igor closed with the image that framed the whole talk. Best practices are paracetamol: they suppress the symptom but do not cure the disease. Mathematics is the differential diagnosis that locates the cause. The aim of the talk was not to add another tip to the list. It was to show how to find the lever that makes the rest of the list unnecessary. For an in-depth look at the n-gram method, see our article on n-gram analysis for Google Ads and the ADworld case write-up.
Full recording of this talk is part of our bonus pack for students.

Third-party traces
Key takeaways
Marketers have too much data, not too little. Mathematics finds the lever that 80% of best-practice advice cannot reach.
Hofstede’s six dimensions, public benefit data by ZIP and n-gram analysis are three repeatable levers for international PPC.
Best practices treat symptoms. Mathematics is the differential diagnosis that finds the cause.
Other talks
All of Igor's other conference talks are collected on one page: where else Igor Ivitskiy has spoken.