
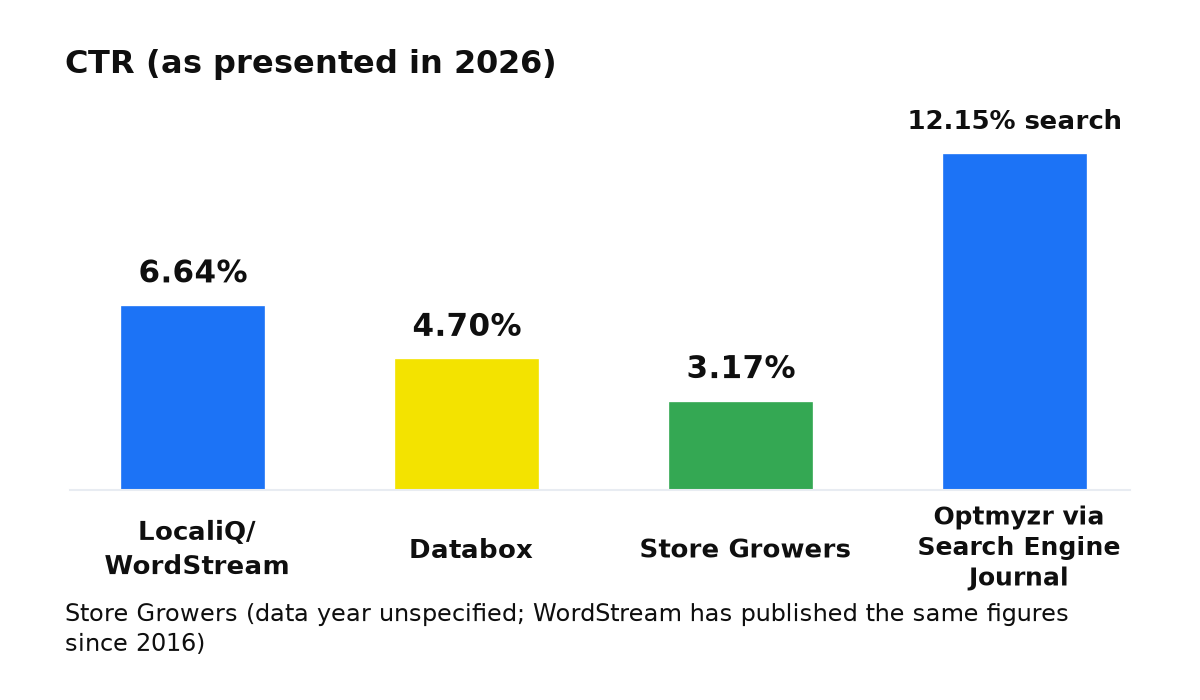
I compiled 1,516 published Google Ads benchmark values into an open table. Of those, 94.2% belong to the WordStream/LocaliQ report family. Yet Store Growers lists a click-through rate (CTR) of 3.17% in an article labelled 2026 without specifying the year of the data, while Optmyzr reports 12.15% for search campaigns in Q1 2026, as covered by Search Engine Journal. That nearly fourfold gap partly reflects old figures presented as fresh: WordStream has published the same 3.17% since 2016. Samples and metric definitions also differ.
Cost per click (CPC) tells a similar story. LocaliQ/WordStream reports $5.42 for US search, Store Growers reports $2.69 for search globally, and Databox reports a global median of $1.53. An average reflects the magnitude of the values, while a median marks the middle of an ordered set. Those are different ways to describe performance, so check the label before judging your account.
This comparison covers published reports; the Google Ads benchmarks hub covers our own panel. In my account reviews, business owners often bring a published average CTR as their target without knowing it describes US campaigns. My first question is whether that comparison fits the business at all.
Who publishes Google Ads benchmarks?
The full compilation covers 26 pages from ten publishers: WordStream/LocaliQ, Databox, Store Growers, First Page Sage, Wolfgang Digital, Optmyzr, SISTRIX, Adthena, Varos and official Google statistics. The table below compares headline figures as presented in 2026. The complete download, linked at the end, includes every collected value with its URL and exact quotation.
| Publisher | What it measures | CTR (as presented in 2026) | CPC (as presented in 2026) | Country | Average or median |
|---|---|---|---|---|---|
| LocaliQ/WordStream | Search campaigns | 6.64% | $5.42 | US | Campaign average |
| Databox (current snapshot, ratio 0.047 = 4.70%) | Google Ads in Databox accounts | 4.70% | $1.53 | Global | Account median |
| Store Growers (data year unspecified; WordStream has published the same figures since 2016) | Search ads | 3.17% | $2.69 | Global | Published average |
| Optmyzr via Search Engine Journal (Q1 2026) | Search separately; all campaign types combined | 12.15% search; 2.22% all types | Not included in this comparison | Global | Aggregation method not specified here |
Read across each row before comparing down a column. Databox does not describe the same campaign sample as LocaliQ. Optmyzr’s figure for all campaign types does not replace its search figure. Removing those labels would make the table easier to scan and much harder to interpret correctly.
Coverage is uneven, too. In the complete compilation, 91.3% of values concern the US or North America, including entries marked as presumed US. There are four European values, all from Wolfgang Digital, and none for Ukraine or Eastern Europe. For a UK business, a large collection of reports still leaves a local comparison gap.
Why do the same metrics produce different numbers?
Start with what CTR means. LocaliQ/WordStream measures clicks relative to ad impressions in client campaigns. Research from First Page Sage and SISTRIX includes click shares by search result position. Those answer different questions. They should not become interchangeable account targets simply because a summary calls both CTR.
The calculation matters as well. LocaliQ/WordStream publishes campaign averages, Databox publishes account medians, and Ivitskiy Ads Lab reports advertiser medians for our panel. I keep those descriptions beside the figures when discussing performance with an owner. Dropping the calculation method drops part of the meaning.
Even a matching year in the headline is not enough. WordStream’s report published in November 2022 gives a mean CPC of $2.96 across LocaliQ campaign cycles in North America from October 2021 to September 2022; that value was checked again during compilation. WordStream’s report published in May 2023 gives a ‘2022 CPC’ of $4.22 for a different sample of US search campaigns covering Google Ads and Microsoft Ads; its sample note identifies the figures as medians. The second entry retains its quotation but was not independently rechecked. The shared ‘2022’ label thus covers different reporting windows, samples, platforms and even calculations: a mean versus a median.
When reviewing an agency report, ask why that particular benchmark was chosen. Does its market match yours? Does it measure the same campaign type? What was averaged? Those questions make a better starting point than demanding the highest CTR found online. For the metric itself, see my guide to CTR in Google Ads.
What does a click cost across US industries?
LocaliQ/WordStream’s 2026 report covers 23 US industries. The industry figures show why an overall average can be a poor starting point for a particular business. For a dental practice, I would begin with the relevant category and then check the other conditions of the comparison.
| US industry in LocaliQ/WordStream 2026 | Average CPC |
|---|---|
| Arts and entertainment | $1.63 |
| Dentistry | $8.00 |
| Home and home improvement | $8.33 |
| Legal services | $9.87 |
These LocaliQ/WordStream industry entries were transcribed from the published table and were not separately rechecked. They offer US context, rather than a personalised target. For a UK business, matching the industry name does not solve the geography mismatch. I would keep that limitation visible in any planning document.
Our panel illustrates the comparison problem. Median search CPC for ecommerce in our panel was $0.43 in 2025. This cell is stable when individual advertisers are excluded: the shift is 0.6%. For context, LocaliQ/WordStream’s average US search CPC for 2025 was $5.26. Our panel is predominantly Eastern European and reports advertiser medians, while LocaliQ/WordStream reports a US campaign average. These figures do not establish an agency advantage or measure a market price gap: both the samples and the calculation differ.
How to choose a benchmark for your account
In my reviews, I use this checklist before discussing performance targets. Work through it with whoever manages your account. The aim is to choose a comparison that helps explain your results and to keep its limitations attached when the report reaches the business owner.
- Match the country. Look for the market where you advertise. A global figure does not provide a separate measurement of your country.
- Match the campaign type. Compare search with search. Keep an all-campaign figure as broader context rather than substituting it for a search benchmark.
- Read the metric definition. Record whether the figure is a campaign average, an account median or a click share by position. Keep that description beside the value.
- Check the period and industry. Separate the publication date from the period measured. Choose the relevant industry category where one is available.
- Bring in your own history. Compare the account with a comparable period in the previous year. In my reviews, that is the starting point; external reports help refine the questions.
I would keep the chosen benchmark and a short explanation together in the account review. If the comparison cannot survive those checks, find a better one before using it to assess the person managing your advertising.
If you want to compare your account with its own history and identify which external benchmarks are relevant, we can review it together.
My e-book “19 Google Ads Secrets”: how to get the most out of Google Ads without draining your budget, drawn from real campaigns and tests.
See the book →When this does not apply
When a panel is treated as the whole market. Our panel describes its participating accounts. A global report is not automatically representative of your country either. The absence of Ukrainian entries in this compilation does not prove that no Ukrainian research exists; it describes the limits of this collection.
When a historical median becomes a forecast. An average or median describes its reporting period. I do not turn it into a promise about future click prices. If the country, campaign type or metric definition does not match, I look for a more relevant comparison before judging performance.
Questions and answers
What is a good average Google Ads CTR?
This compilation does not produce a universal target. Choose the relevant country, campaign type, period and calculation first. Then the comparison has a clear meaning.
Should I still use WordStream benchmarks?
I use the WordStream/LocaliQ series with its market and methodology attached. Its large share of the compilation indicates concentration of data, not a verdict on report quality.
What if there is no suitable local report?
I start with the account’s own history over comparable periods. An overseas report can add context, provided its differences from your situation remain explicit.
Where the data comes from
The file industry_meta_benchmark.csv contains 1,516 published values with URLs and exact quotations; you can download and check it on Hugging Face and GitHub. During compilation, 30 values were independently rechecked; verified=false means an entry was not rechecked, not that it is incorrect. A separate check of 24 headline values confirmed 23 and removed one without a date. The compilation is licensed under CC BY 4.0, with published figures attributed to their publishers.