
You open Google Ads, see a 95% Optimization Score, and feel good. That feeling is the product. The score is not a measure of how well your account performs. Google calculates it from your account statistics, settings, available recommendations, and recent recommendation history, and it moves whenever you apply or dismiss a suggestion.
In the accounts I analyzed, that number did not track where the money actually went. Let me show you the data, then what to look at instead.
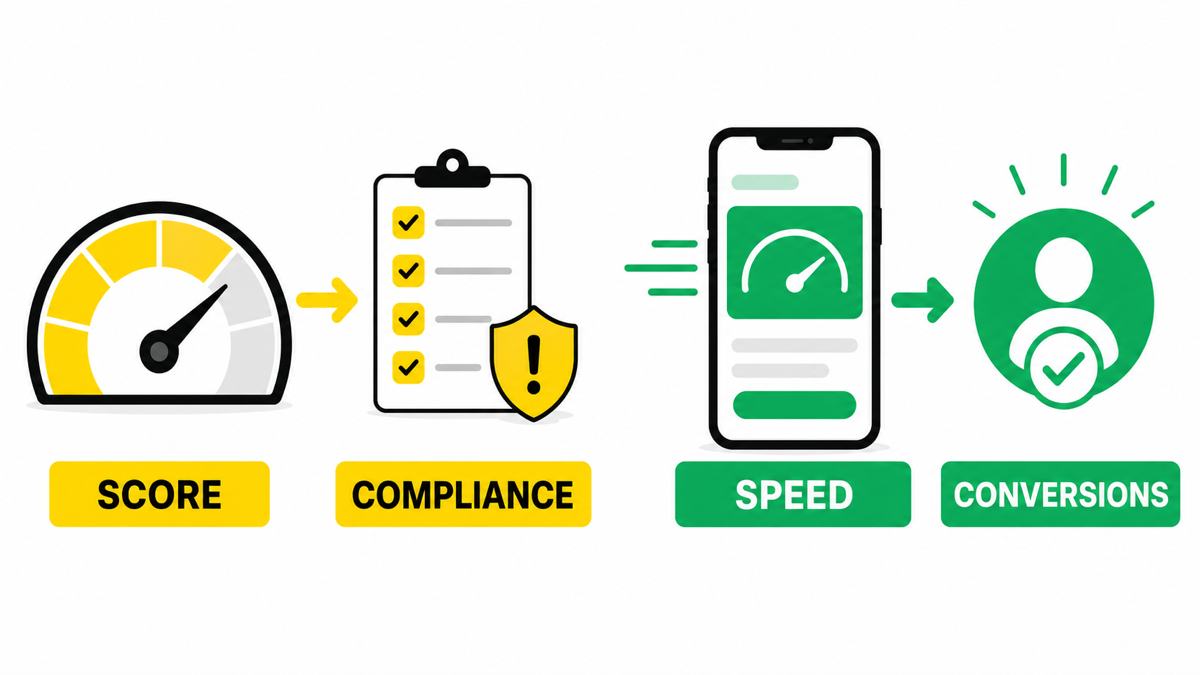
The score measures compliance, not performance
Look at those two accounts again. The one Google graded near perfect was the wasteful one. The one Google graded barely above half was the most efficient in its vertical. In this sample the score did not predict zero-conversion spend, and in these cases it pointed the wrong way.
This makes sense once you see what moves the score. Applying or dismissing Google’s suggestions moves it: broaden match types, add automated assets, raise budgets, adopt Smart Bidding. Every one of those can help or hurt depending on your business. The score does not tell you whether a change improved profit, lead quality, or customer value. It reflects your account’s alignment with current recommendations, nothing more.
Ad Strength tells the same story
The pattern repeats with Ad Strength, the label on your responsive search ads. Across 116,785 ads in the sample, impression-weighted click-through rate ran 9.73% for ads rated “Poor” and just 2.93% for ads rated “Excellent”. This is a pooled comparison, not proof that a low rating causes more clicks. But it is enough to show the rating is not a performance outcome.
Ad Strength evaluates the relevance, quantity, and variety of your ad assets. Google states plainly that it is not used to calculate Ad Rank or Quality Score and does not affect whether you win the auction. It is an input, not an outcome. Treating it as an outcome is how accounts get optimized toward a green dashboard and away from profit.
The one signal that behaved as advertised
Out of the Google-reported signals I tested, exactly one lined up with results the way you would hope: mobile landing page speed. Across accounts with mobile-speed data, landing pages scoring 9 or 10 converted 3.65% of ad clicks, against 1.28% for pages scoring 1 to 5. That is 2.85 times the conversion rate, observed in this sample.
That is the tell. The signals tied to the machinery Google sells you, the score and the strength rating, are weak predictors. The signal tied to your customer’s actual experience is strong. Optimize for the second kind.
What to check instead of the score
- Share of spend on search terms with zero conversions over the last 30 days. Above roughly a third of the budget is worth investigating.
- Actual cost per conversion against your target over 30 days, not the label the platform assigns.
- Mobile landing page speed and the conversion gap between fast and slow pages.
- Which recommendation types are set to auto-apply, and whether any quietly widened your keywords.
The researcher’s take
After looking at dozens of accounts, my rule is simple: a dashboard metric earns trust only when it moves with money. The Optimization Score did not in this sample. It is a compliance meter presented as a performance meter, and it rewards handing more control to the platform. Use it to see what Google wants. Judge your account by conversions, wasted spend, and what happens after the click.
FAQ
Should I ignore the Optimization Score completely?
No. Read it as a list of what Google would like you to change, then decide each item on its merits. Some suggestions are genuinely useful. The mistake is treating the number itself as a goal.
Does a low score hurt my ads?
The score itself is not an Ad Rank input. The cleanest account in this sample scored 48.8% and had the lowest waste. What decides the auction is your bid, auction-time ad and landing-page quality, thresholds, competition, and search context, not your agreement rate with recommendations.
My e-book “19 Google Ads Secrets”: how to get the most out of Google Ads without draining your budget, drawn from real campaigns and tests.
See the book →