
When a report looks convincing but gives the owner no clear next move, analytics becomes another screen to review instead of a basis for action. This guide shows how to turn advertising data into a short weekly dashboard that makes the next step clear.
Google Analytics 4 measures what people do on your site, but it does not know your full business economics. You cannot open GA4 and expect a complete answer to whether advertising made money. That answer appears only when visitor behavior is connected to sales value, actual payment, and margin.
Which five numbers should an owner watch?
Build a short owner dashboard. Do not copy every column from an ad platform. A metric deserves space only when you know what decision follows from a change.
| Number | What it tells the owner | Decision |
|---|---|---|
| Ad spend | How quickly the budget is being used | Compare actual pace with the plan |
| Valuable actions | How often people did something the business considers a result | Verify lead quality or payment |
| Cost per valuable action | How much advertising spend produced one useful result | Compare the cost with deal economics |
| Sales value | The dollar value connected to recorded results | Check where that value came from |
| Money left after costs | What remains after direct costs and advertising | Scale only what the margin can support |
GA4 will not create the final row for you. Analytics can preserve a source, an event, and a value sent by your site. It does not automatically know cost of delivery, refunds, or whether the customer paid. Our guide to ROAS in Google Ads connects ad spend with revenue, but return on ad spend still is not profit.
Your dashboard should be boring and stable. If the definition of a valuable action, the revenue source, or the comparison window changes every week, there is no trend. You are applying different rulers to different objects. Stable definitions matter more than a sophisticated layout.
Read the rows in pairs. Spend without valuable actions shows only how fast money is leaving. Actions without a quality check can reward junk calls. Revenue without margin can look impressive while a sale loses money. Profit without a source does not explain which advertising created it.
Keep a compact decision log beside the dashboard. Record what changed, which signal justified it, and what you expect at the next review. Without that note, it is easy to credit the latest campaign edit even though the offer, landing page, or sales response changed at the same time.
Why sessions and bounce rate do not make the decision
Sessions, views, and bounce rate can help diagnose a website. They may show where a visitor lost interest. They are not the advertising outcome. A session is not a sale. A low bounce rate does not prove profit. A long visit does not prove that the offer worked.
Separate diagnosis from outcome. A behavior metric helps you choose where to investigate. A business metric tells you whether the valuable action happened and whether the economics worked. When those levels are mixed, a report can use attractive engagement to explain away missing sales.
The Realtime report is especially tempting. Google presents it as a way to verify that measurement code is working, and describes delivery as a best effort service. Use that screen when testing an event. Make management decisions from completed data for yesterday in both GA4 and Google Ads.
Where money exists in GA4, and where it does not
GA4 can receive the value of an event or purchase when your site sends it. That is an input, not finished profit. The reported value does not know your margin, staff time, canceled order, or failed payment unless your business sends those facts back.
Ask two questions about every money column. What real action sits behind it? Where did its value come from? If the answer is simply that someone configured it, the metric is not ready for a decision. The marketer should trace the path from ad click to lead. The business should confirm quality and payment.
This distinction matters in service businesses. A form can be submitted correctly and still contain an unqualified request. A call can happen without becoming a deal. The ad system can answer whether interest was recorded. Your sales system must answer whether that interest was valuable and produced money.
Old reports can also use an obsolete product structure. Standard Universal Analytics properties stopped processing data on July 1, 2023. The current GA4 hierarchy contains an account, a property, and a data stream. GA4 has no view entity. If an instruction asks you to select a view, check whether it describes the retired product.
How the Google Ads tag differs from the Analytics tag
The tags may observe similar actions, but they serve different jobs. The Analytics tag helps describe behavior on the site. The advertising tag supplies campaign algorithms with a result signal. When that signal disappears, automated strategies stop receiving the data they used to find future customers.
Auto tagging is another part of the chain. After an ad click, it adds a gclid parameter to the landing page URL. Without auto tagging, Analytics does not receive the full set of Google Ads details about keywords, search queries, and cost. The official auto tagging guide explains both the identifier and the data transfer.
An owner should not settle for “analytics is installed.” Ask which tag records the business result, which signal the campaign receives, whether auto tagging is enabled, and whether the Ads account is linked with Analytics. A general assurance does not reveal the measurement chain.
How to tell when tracking is broken
Suspect a tracking problem when spend continues but a familiar valuable action suddenly disappears, when recorded events do not resemble the leads in your sales system, or when the person managing ads cannot demonstrate a test journey from click to recorded result.
- Complete a test valuable action on the site.
- Use the Realtime report to confirm that the measurement code saw the event.
- Check the completed report the next day.
- Match the advertising result to a lead or sale in your business system.
- If the chain breaks, do not change budget based on incomplete data.
Advertising without conversion tracking can look acceptable for a long time. In one client case, the weakness became obvious when a competitor arrived with measured data and trained campaigns on real signals. This is a single practice observation, not a market rule. Its lesson is narrower: without measurement, the owner cannot see what the budget actually bought.
Why Google Ads and Analytics numbers do not match
Do not demand automatic equality from tools doing different jobs. The advertising tag provides campaign feedback. Analytics records behavior on the site. The Realtime report also delivers data on a best effort basis. A discrepancy is first a reason to inspect the chain, not proof that one screen is lying.
Investigate a specific action instead of a total. Was there an ad click? Did the gclid survive? Did the site record the intended event? Did the lead reach the sales system? Did the business confirm its value? This sequence finds the broken link. Forcing total columns to agree only hides it.
Assign a working screen to each decision. Manage budget and campaigns where they run. Study behavior after the click in Analytics. Confirm payment and margin in business records. A unified dashboard is convenient, but it does not erase data provenance or turn an assumption into a fact.
The weekly review
Open the owner dashboard on the same day each week. Start with spend and budget pace. Then review valuable actions and cost per result. Match reported value with sales and margin. Finish by recording one decision, the expected effect, and the person responsible.
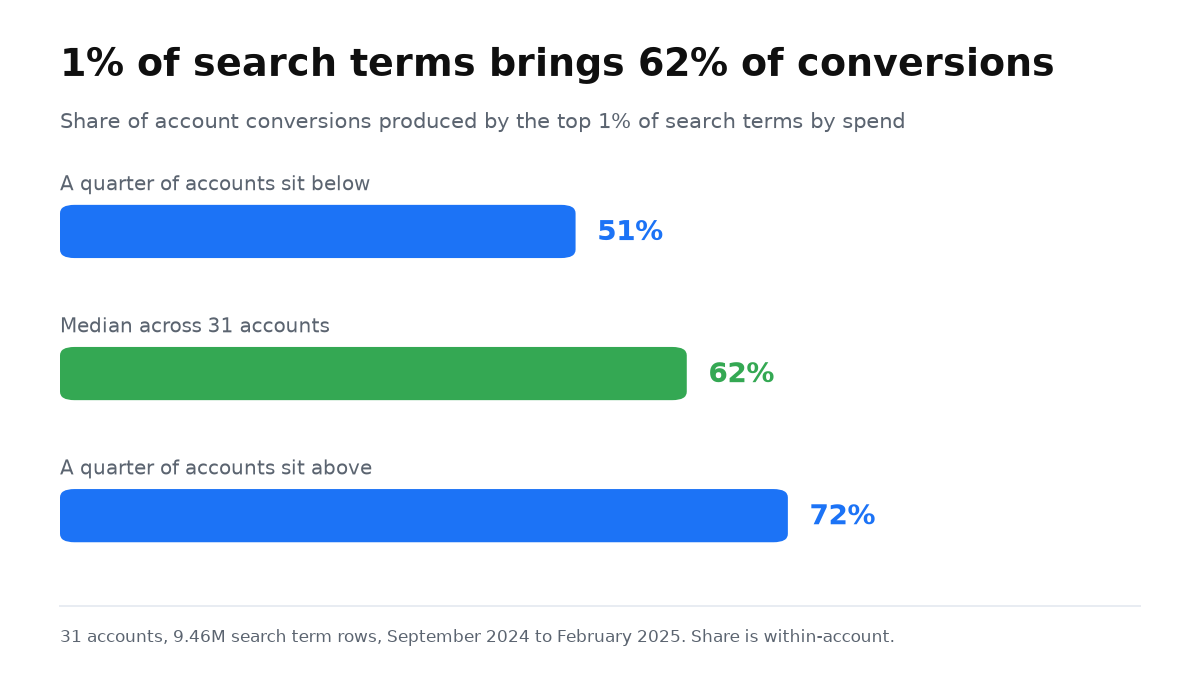
Do not spread attention evenly. In an internal analysis of search queries, a median 62% of an account’s conversions came from only the most expensive 1% of queries. The middle half of accounts ranged from 51% to 72%. The sample covered 9.46 million query rows from September 2024 through February 2025. These were micro SaaS accounts, not local service businesses, so the percentage is not a benchmark for your company. Use the finding only to set the inspection order: begin with the most expensive queries.
When deeper analytics is worth the effort
Go deeper when the basic numbers are stable, the valuable action is correctly defined, sales are confirmed by the business, and the next decision truly depends on a finer segment. You may already understand overall ad economics but still need to learn which type of demand creates better customers.
Deep analytics is often not the first lever for a small business. If the offer is weak, leads go unanswered, or the page does not explain value, another report will only describe the problem more precisely. Fix what changes the customer’s decision first. Add measurement depth afterward.
Each of the five numbers breaks in its own way, so it is easier to work through them one at a time. When sources do not add up, read about UTM tags and auto-tagging. When it is unclear who owns the accounts, see access to Google Ads and Analytics. When there are too many reports, the working approach is three answers instead of dozens of screens. When it is unclear what counts as a result at all, start with key events in GA4, while bounce rate and the limits of the free tier explain why the numbers in reports look strange.
When this does not apply
The five number dashboard cannot give an honest answer when the business has not defined a valuable action, does not check lead quality, does not pass sales value, or does not know its margin. In that situation, the dashboard creates an impression of control while its money columns rest on guesses.
The approach is also too small for a complex organization with several products, a long sales cycle, many channels, and complicated access rights. That environment needs a deeper data model. Even then, the work starts with the same question: what decision will the owner make from each number?
A dashboard of five numbers shows the state of things. A managed system is a different thing: every deviation has an agreed action behind it rather than a meeting. That transition is what we walk through step by step.
Tags and reports matter when they show payback. My e-book “19 Google Ads Secrets” shows how to get the most out of Google Ads without draining your budget, drawn from real campaigns and tests.
See the book →What to ask your marketing provider
Ask for an auditable chain, not a presentation containing every metric. Which actions count as valuable? Which tag records them? Is auto tagging enabled? Where does value come from? How is the result matched with a sale? What change does the provider recommend because of the data?
A useful report can be checked through a specific example. Ask to open an expensive search query and show the spend, advertising signal, site event, and business outcome. The built-in Ads report does not display every query. In one client account, linked Analytics showed roughly 5 times more. That is a single account observation, not a market average, but it demonstrates why every report should name its data source.
If the clicks are already arriving but the outcome is missing, do not hide the problem inside a new dashboard. Diagnose why clicks produce no leads. The cause may sit in the offer, landing page, or sales response rather than analytics.
Where to start when you have nothing
Do not start with a dashboard. Name one action that genuinely moves money closer, then decide how the business will verify its quality. Check the advertising tag, Analytics tag, the link between Ads and Analytics, and auto tagging. Detailed keyword and cost data require a linked ad account and auto tagging, as the Google Ads data in Analytics guide explains.
After a successful test action, create the simple five-row dashboard. You do not need a perfect end-to-end data system before the first decision. You need enough confidence to avoid scaling broken tracking, avoid stopping healthy advertising because of noise, and know which question comes next.
Questions and answers
Can GA4 alone tell me whether ads are profitable?
No, not when GA4 lacks correct value or the business has not added margin and final sales status. The tool shows behavior and recorded events. The final money decision needs your business economics.
Should an owner open Analytics every day?
A weekly rhythm is enough for the basic review described here. Open reports outside that schedule when testing tracking, investigating a sudden change in valuable actions, or checking a specific problem.
Which matters more, Ads or Analytics?
They serve different jobs. Ads manages advertising and receives signals for campaign algorithms. Analytics helps explain behavior after the click. The owner gets a decision only after matching both with sales.
What is the first sign of a poor provider report?
It contains many metrics, but none ends in a proposed decision. Another warning appears when the provider cannot explain which real action sits behind a conversion or where its value came from.