
ecomTEAM 2025 took place in Brasov, Romania, on September 18-19, 2025; this was an in-person conference talk on September 18. The speaker was Igor Ivitskiy, a scientist and advertising practitioner who has applied mathematical modelling to PPC for 18 years.
“Google Ads Secrets: A Scientist’s Approach to PPC Optimization” was about the overlooked side of familiar reports. Instead of treating every weak row as something to remove, Igor connected search and keyword evidence with product range, page relevance, basket value and long-term customer behaviour.
Missed demand, intent mismatches and low-value orders can sit behind apparently weak rows.
A product can introduce, retain or reconnect a customer even when its direct return looks poor.
Search behaviour and geography can reveal purchasing context that broad averages conceal.
The useful data is often the data that looks wrong
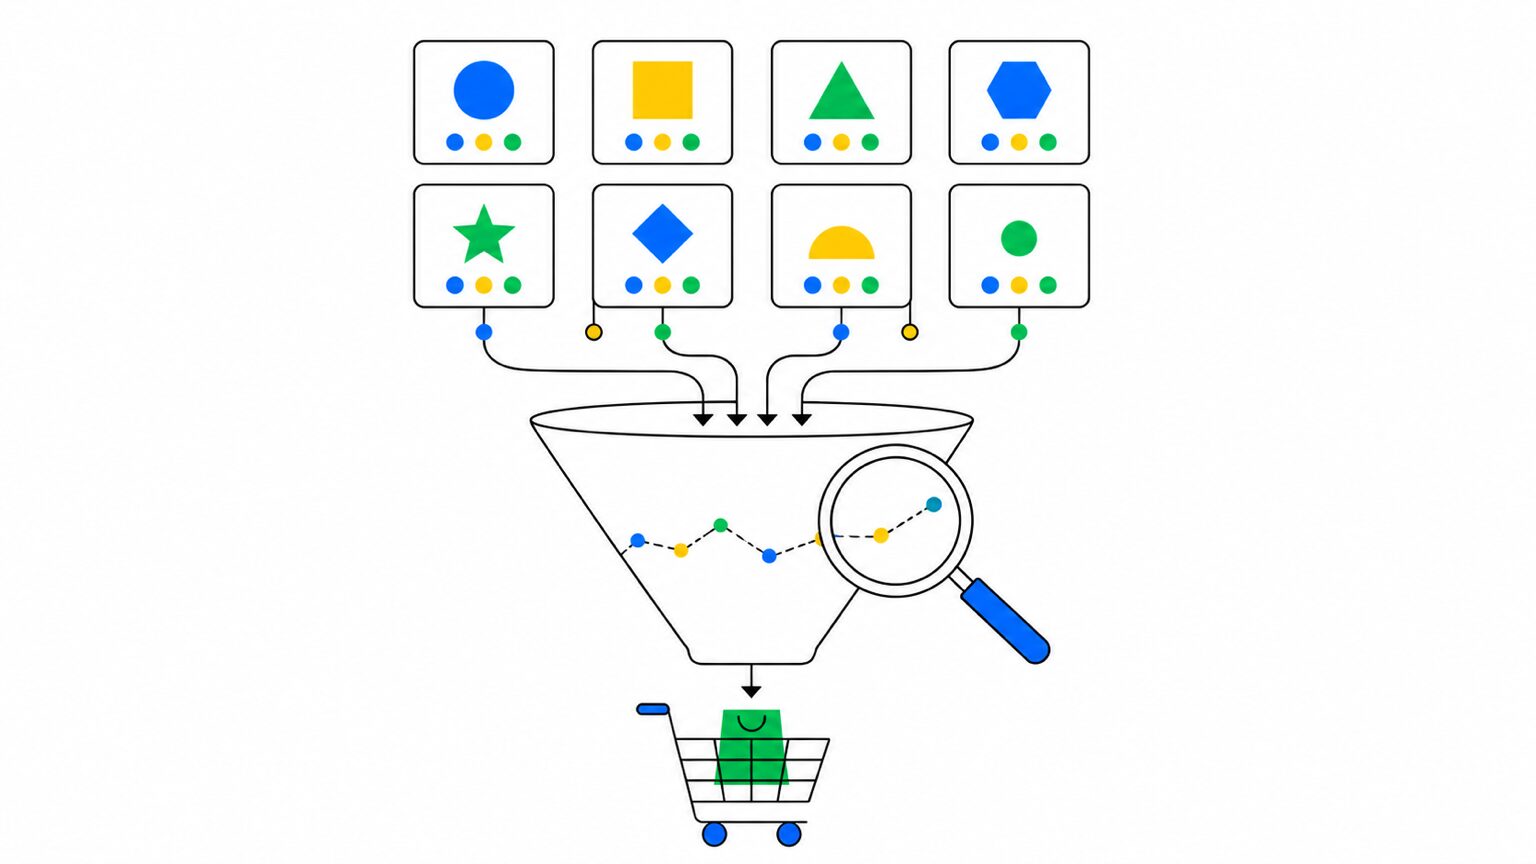
Advertising dashboards encourage a narrow verdict: scale what converts and exclude what does not. The talk challenged that reflex. An impression without a click may point to demand for a product the store does not carry. A click without a sale may expose a mismatch in price, terms, colour, size or page content. A low-value order may say more about cross-selling than about the query that brought the visitor.
The same logic changes how a retailer reads its catalogue. Google explains that Shopping and Performance Max campaigns use product data such as images, prices and descriptions to match products with searches. That makes the feed more than an ad input. It is also a map of how the assortment attracts attention, creates repeat demand and keeps shoppers from leaving for a competitor.
This is why the talk sits above debates about broad match or any single campaign type. The underlying principle is to separate an observed metric from the business explanation behind it. One number can support several stories, so the next useful move is often a better question, not an automatic exclusion.
A weak click, conversion or product-level return appears in the report.
Is the cause demand, offer fit, merchandising, retention or audience context?
The answer may belong to advertising, the website, the product range or the commercial model.
My principle for reading weak traffic
I do not treat a poor row as a verdict. Even when negative keywords are relevant, I first ask whether the data is describing an advertising problem or exposing a gap elsewhere in the business.
This habit of connecting campaign data with the wider business is also part of how we teach Google Ads: the report is evidence, while the decision depends on context. The training goes deeper into the working process without turning one conference example into a universal recipe.
My e-book “19 Google Ads Secrets”: how to get the most out of Google Ads without draining your budget, drawn from real campaigns and tests.
See the book →Key insights
- No click does not always mean no demand. Impressions can expose requests for products or categories that the current range does not answer.
- No conversion does not always mean bad intent. The mismatch may sit in the page, offer, price, conditions or available variant.
- Direct product ROAS can hide a wider role. Some products attract attention, create repeat purchases or preserve customer demand for the store.
- Audience data can change the economics of reach. Google documents that custom segments can use relevant search terms and URLs as inputs, opening a layer beyond a standard search campaign.
- The right unit of analysis is the business journey. Search, catalogue, page and repeat purchase data become more useful when read together.
Key moments from the talk
The dark side of familiar reports
Igor opened with the Moon. People observed it for thousands of years, and astronomers could describe craters and visible structures, yet the hidden side required a different line of attention. The metaphor set the standard for the whole talk: a report can be familiar without being fully understood. Teams may inspect it every day and still see only the rows that fit the usual optimization routine. The hidden part is not secret data stored elsewhere. It is evidence already present in the account but classified as noise, failure or a minor exception. Igor had deliberately chosen this strategic frame over a single data-processing tactic. After 18 years of applying mathematical modelling to advertising, he wanted the audience to leave with questions that could travel across products and platforms, not only with another technique for one interface.
The question from the stage was direct: “What if data, your data, also has its own dark side?” That question moves the conversation away from dashboard hygiene and toward explanation. A weak metric is still a weak metric, but its cause may sit outside the campaign. The advertiser therefore has to distinguish what the interface records from why the business produced that outcome. This distinction was the scientific core of the presentation: observed numbers matter, but the first explanation attached to them remains a hypothesis. Even skilled teams can perform sophisticated search-term analysis and preserve the same blind spot if they examine only rows with clicks and cost. Better processing does not help when the useful observation was discarded before the analysis began.
Search terms and products as business evidence
The search terms report supplied the first example. Teams normally focus on clicks, cost and conversions, then ignore impressions without clicks because no money was spent. Igor reframed those rows as possible evidence of assortment demand. A recurring search may describe a category that people expect but cannot find in the store. “What if it’s not just a noise that you need to ignore?” he asked. The answer does not automatically justify adding the product, but it gives the commercial team a question worth testing with suppliers and demand data.
Clicks without purchases create a second ambiguity. Excluding the query may protect short-term efficiency, yet it can conceal a problem with the page, price, terms or product variant. Low-order-value conversions create a similar issue because the gap may be in the store’s cross-selling rather than the visitor’s intent. Product-level reporting can mislead in the same way. A standard volume-and-return view separates obvious winners from products that attract little demand or produce weak direct returns. Igor added another lens: activators that open the door to other purchases, magnets that create repeat demand, and keepers that retain shoppers despite low margins. An expensive showcase product can introduce a visitor to a more affordable choice. A low-value first purchase can establish an ecosystem for later orders. A low-margin popular item can stop existing demand from moving to a competitor. Their value appears across a journey, not necessarily on the first advertised item.
Audience data without the obvious labels
The third part moved from products to people. Standard audience summaries answer who bought, where they live and how acquisition compares with lifetime value. Igor’s hidden layer concerned signals that sit around those summaries. Search behaviour can support audience strategies outside a costly search click. Geographic data can expose areas where affordability or population patterns differ. Indirect local signals can also reveal purchasing power that a platform does not present as a simple checkbox. The strategic lesson is not a fixed targeting recipe. It is that audience design can combine platform evidence with business context, while the relevance of each signal depends on the offer. The sharp question from this part of the talk was simply: “Why they don’t convert?” The value lies in refusing to answer it with a campaign metric alone.
The full recording of this talk is included in the bonus pack for students.
Third-party traces
Key takeaways
A weak advertising row may be evidence about demand, the offer, the catalogue or retention.
The metric says what happened. Better business questions are needed to explain why.